Table of Contents
The State of Liquidity Report, published quarterly, offers valuable insights on the past quarter’s market listings and liquidity landscape. It covers overall market trading trends, volumes and volatility, token listing and delisting activity, and insights on notable listings during this period.
This report may be useful for projects that are looking to launch their own token in the near future, projects that are already listed, as well as investors and other market participants.
All the data used in this report is collected from publicly available sources.
Executive Summary
With the approval of the Bitcoin Spot ETF and whispers of the new bull market, trading volume (and general market sentiment) has picked up across the board. Overall liquidity and volumes in the market have improved significantly compared to numbers in the previous Q3 State of Liquidity Report, indicating the return of market participants and institutions.
...Deeper Insights Ahead
Table of Contents
The State of Liquidity Report, published quarterly, offers valuable insights on the past quarter’s market listings and liquidity landscape. It covers overall market trading trends, volumes and volatility, token listing and delisting activity, and insights on notable listings during this period.
This report may be useful for projects that are looking to launch their own token in the near future, projects that are already listed, as well as investors and other market participants.
All the data used in this report is collected from publicly available sources.
Executive Summary
With the approval of the Bitcoin Spot ETF and whispers of the new bull market, trading volume (and general market sentiment) has picked up across the board. Overall liquidity and volumes in the market have improved significantly compared to numbers in the previous Q3 State of Liquidity Report, indicating the return of market participants and institutions.
We’ve seen the resurgence of activity in the Solana ecosystem as well, fueled by significant airdrops such as Jito and Pyth, while memecoins such as Bonk and dogwifhat have attracted retail back onchain to speculate.
1. Overall Crypto Market
a. Centralised / Decentralised Trading Activity
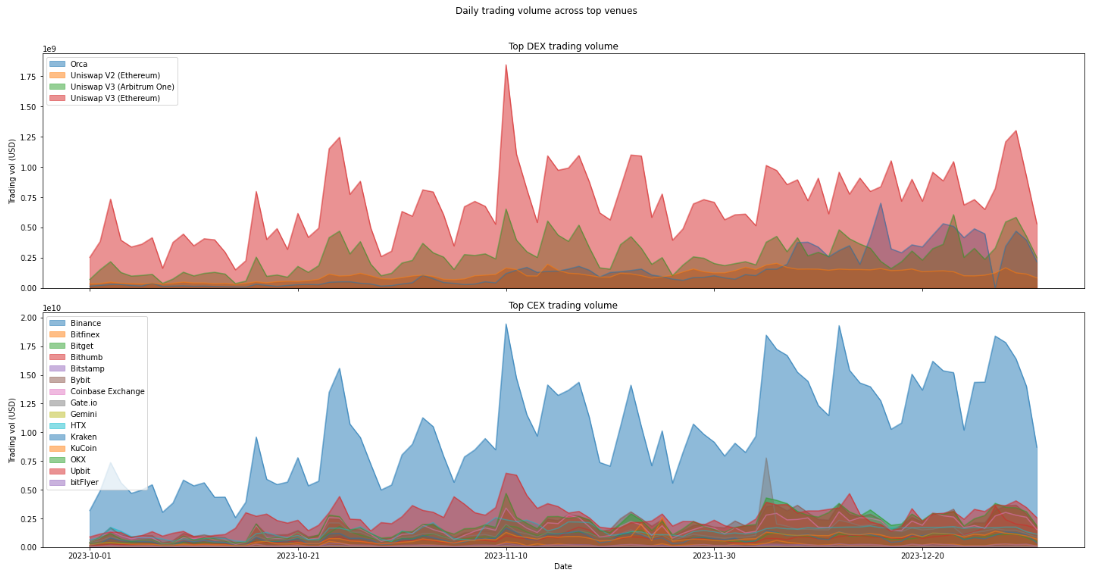
Figure 1: Top 15 CEXs and Top 4 DEXs from CoinMarketCap Ranking.
| Q4 2023 | Q3 2023 | Q2 2023 | Q1 2023 | |
|---|---|---|---|---|
| CEX trading volume | $2.2t | $1.2t | $1.4t | $2.5t |
| DEX trading volume | $111b | $57b | $93b | $137b |
Figure 2: This aggregated trading volume from Top 15 CEXs and Top 5 DEXs from CoinMarketCap, not total volume overall, and is meant to be context for Figure 1.
- Q4 saw an overall uptick in trading volumes given the market anticipation of BTC ETF listing which was expected to happen in early Q4 (and ended happening in Q1 2024, instead). The optimism flowed through to both CEX and DEX venues, nearly doubling trading volumes QoQ, reviving from a low in Q3.
- On the DEX front, Uniswap continued its market dominance. However, Orca, the Solana DEX, saw a sharp pick up in volumes given the rise in prominence of the Solana ecosystem, triggered by the trading of JTO and BONK.
- On the CEX front, Binance maintained its market leading position. However, it continues to lose market share as the SEC sentenced both the exchange and its founder, Changpeng Zhao. There was no clear market correlation between exchange volumes and the indictment at the end of November 2023.
b. Token Listing and Delisting Activity
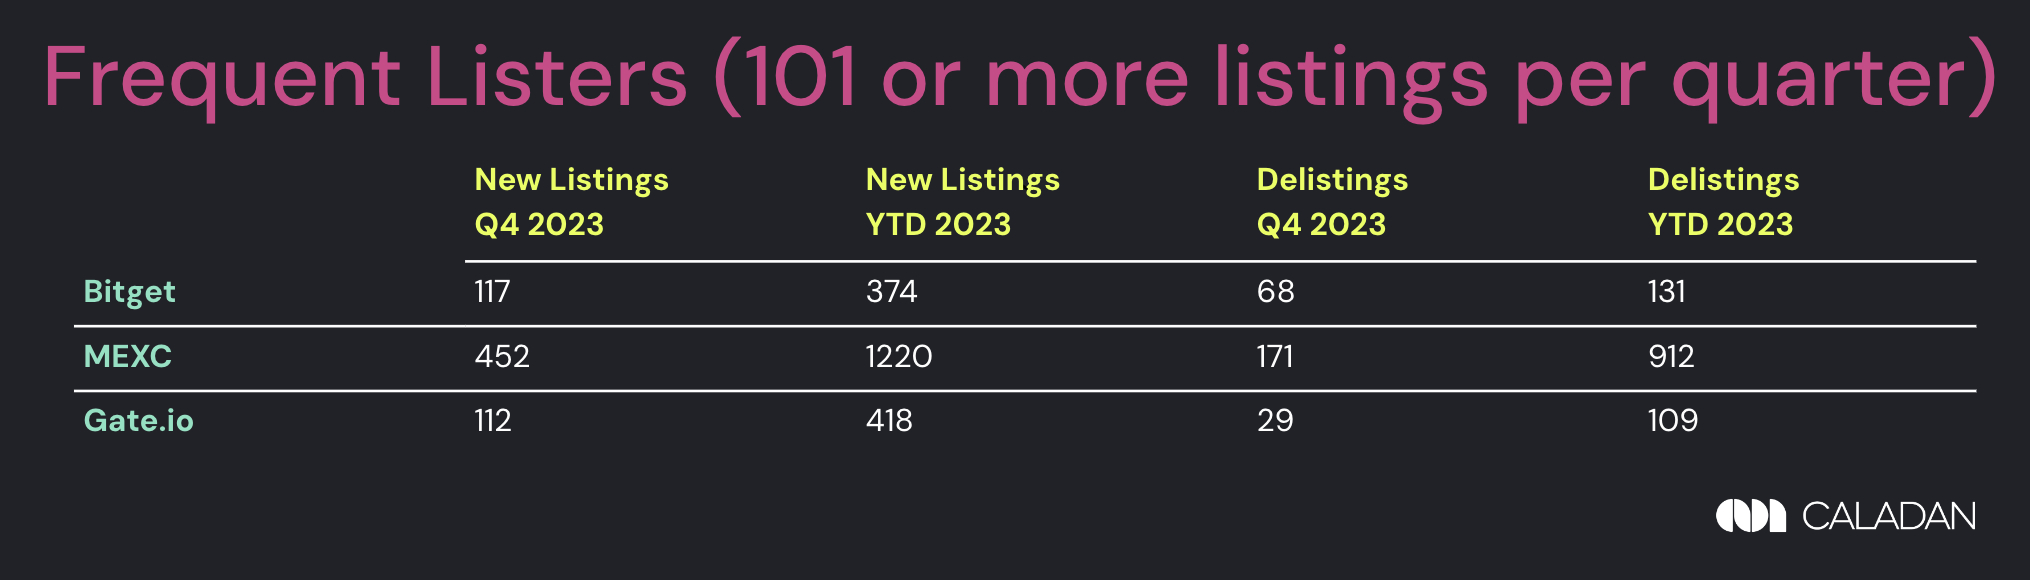
Figure 3: Frequent Listers (101 or more listings per quarter)*
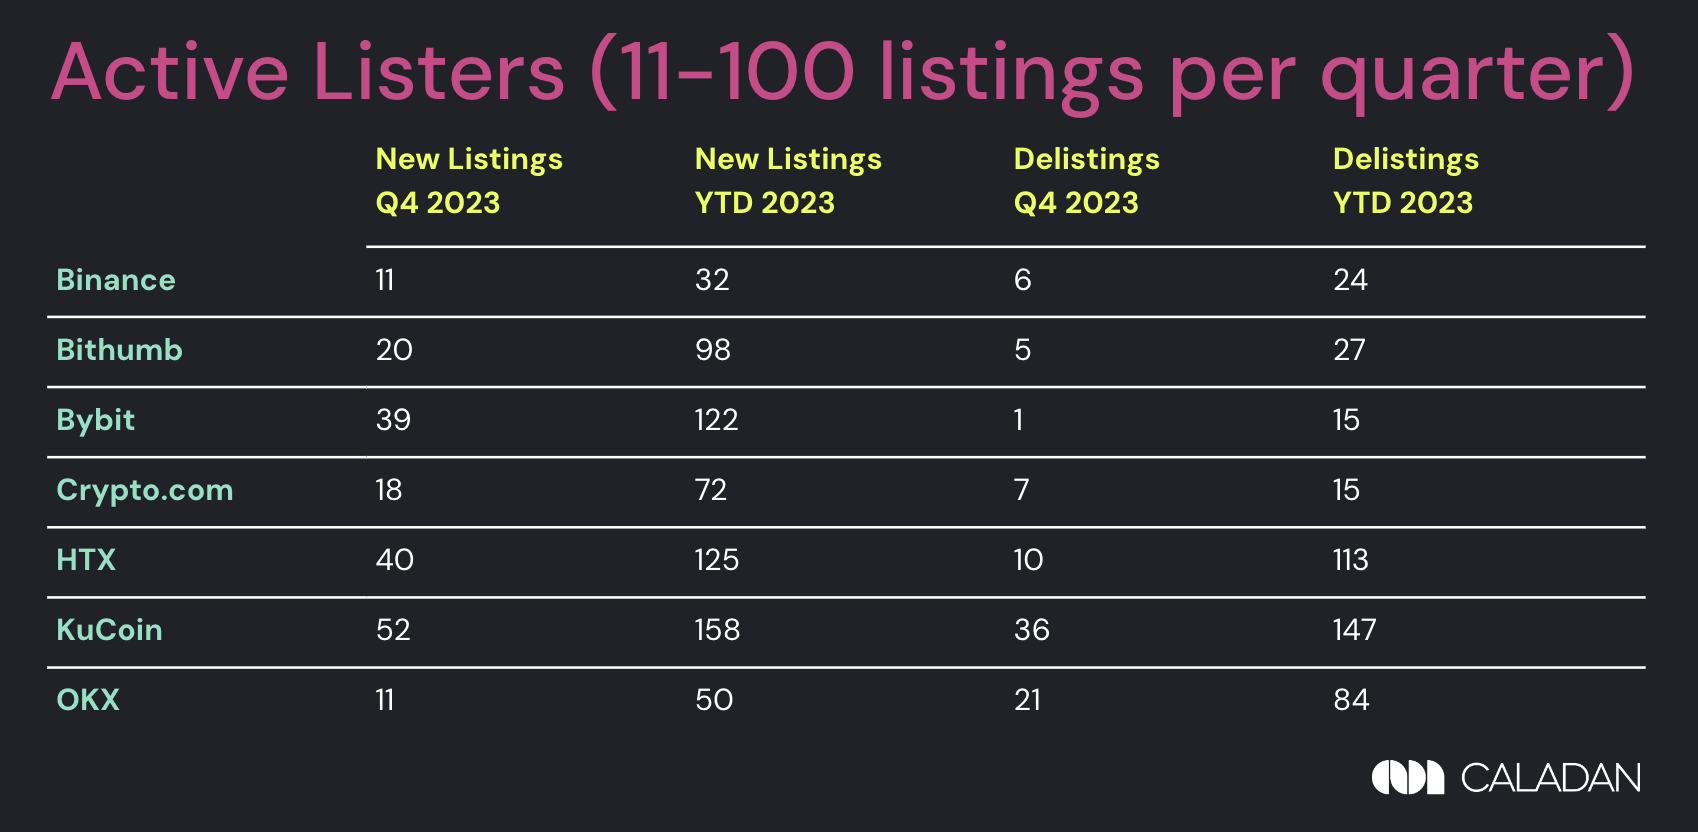
Figure 4: Active Listers (11-100 listings per quarter)*
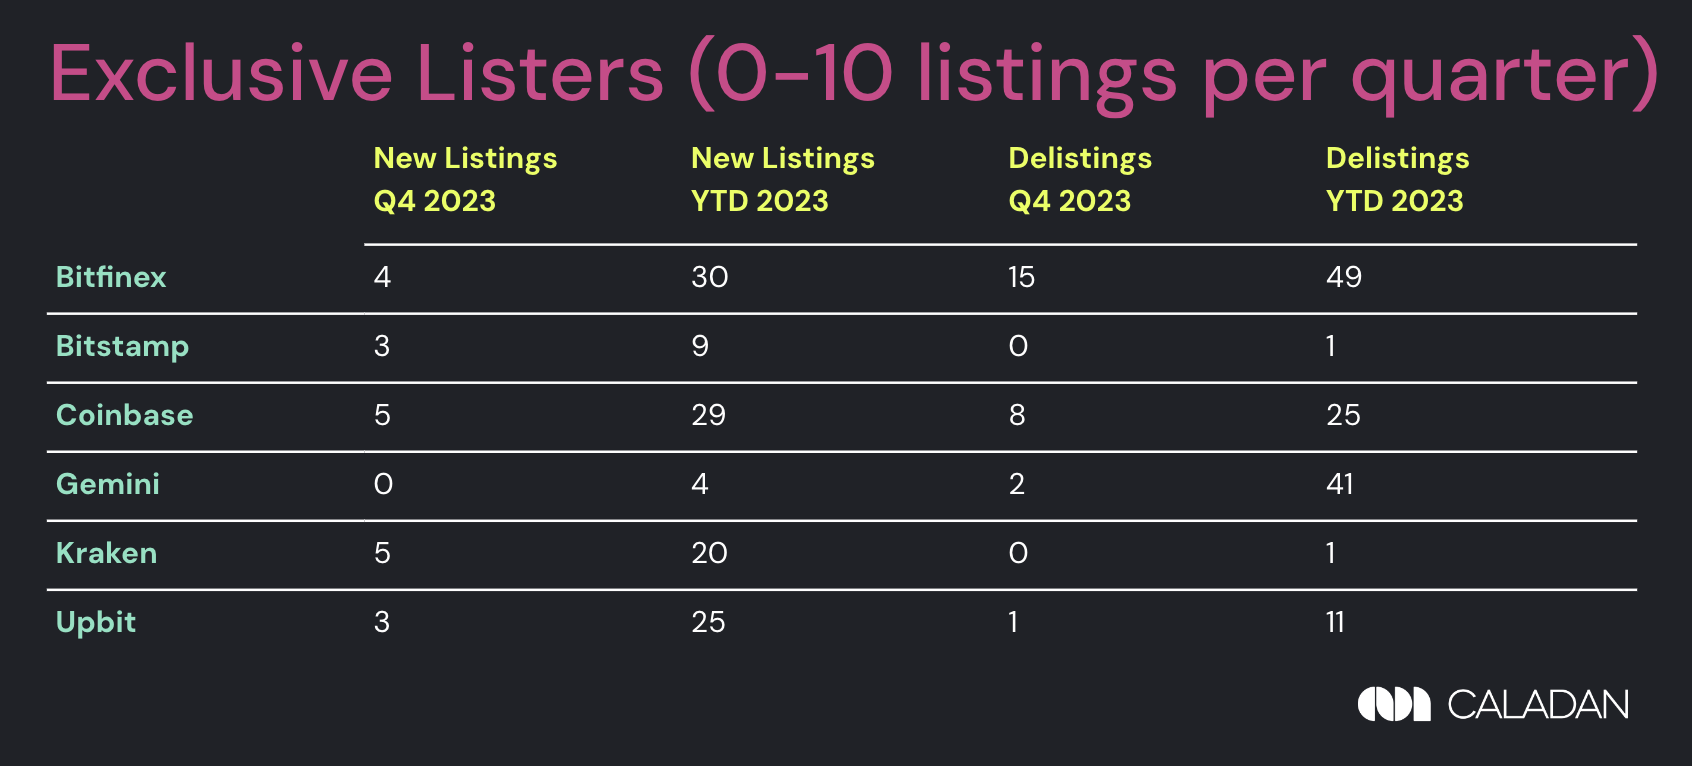
Figure 5: Exclusive Listers (0-10 listings per quarter)*
*CoinMarketCap Top 15 by trust score, with the exception of Bitflyer (and addition of MEXC, as this is a common exchange for new listings). Data on previous listings are pulled from various data feeds and cross checked against exchange announcement pages, their spot trading platforms, and X. Leveraged tokens, rebrands and migrations are excluded.
Compared to our last report in Q3 2023, listing activity picked up significantly across the board, with multiple exchanges jumping into new brackets due to improved listing numbers. The rise in listing volumes reflects the warming sentiment of the general crypto market.
As trading and listing volumes pick up, projects that have held out from TGE during the bear market are starting to launch their tokens and release airdrops to crypto market participants. This has, in turn, also helped to inject fresh liquidity and attention back into the market.
At a glance, MEXC is still leading significantly by a huge lead (several multiples of the competition even on a quarterly and yearly basis), while most exchanges with the exception of Bithumb, Coinbase, Gemini and Upbit saw improved numbers quarter-on-quarter.
Here’s a summary of the main movements:
- Bitget and Gate moved up from Active Listers into Frequent Listers this quarter with over 110+ listings, but MEXC still surpassed the quarterly listing numbers of both exchanges by four times.
- Binance and OKX moved up from Exclusive Listers into Active Listers this quarter with 11 listings each. This is a rare move for Binance, listing nearly a third of their tokens in Q4 alone. This may be a response to their losing market share as well.
- Bithumb, Coinbase and Upbit saw reduced listings this quarter, Gemini surprised with zero listings in Q4.
- Gemini was also the quietest exchange throughout the year with only 4 listings for the whole of 2023.
c. State of Liquidity on Top 1000 Tokens (ranked by ADV)
To provide an overview of the overall state of market liquidity, we survey the top 1000 tokens as listed on CoinMarketCap and detail liquidity metrics across their respective top 3 exchange venues.
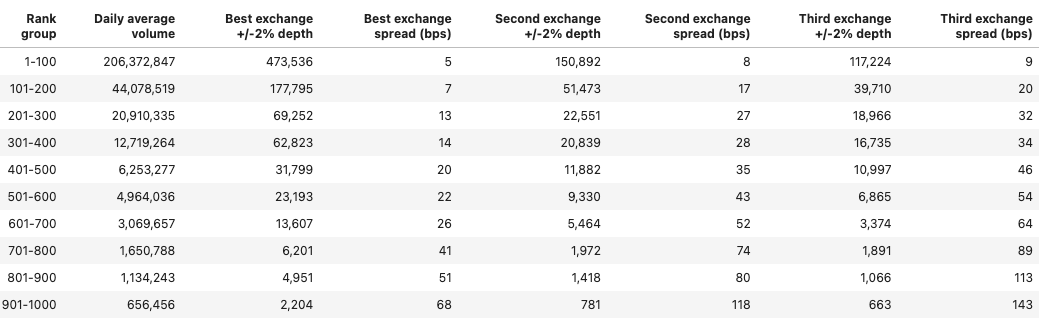
Figure 6: Top 1000 tokens ranked by volume of top performing exchange
Compared to our data in Q3, Daily Average Volume for the top 4 rank groups (1-400) nearly doubled in volume while the other ranks also increased substantially, indicating an uptrend of trading activity across the board. Additionally, increased depths and lowered spreads can be observed – attributed to the larger trading activity for the last quarter of 2023.
Similar to Q3, liquidity is heavily concentrated in the top 100 tokens in terms of (1) daily trading volumes, (2) market depth and (3) spread across the top 3 exchanges for the tokens.
2. Insights on Q4 Notable Listings
Notable Listings in Q4 2023
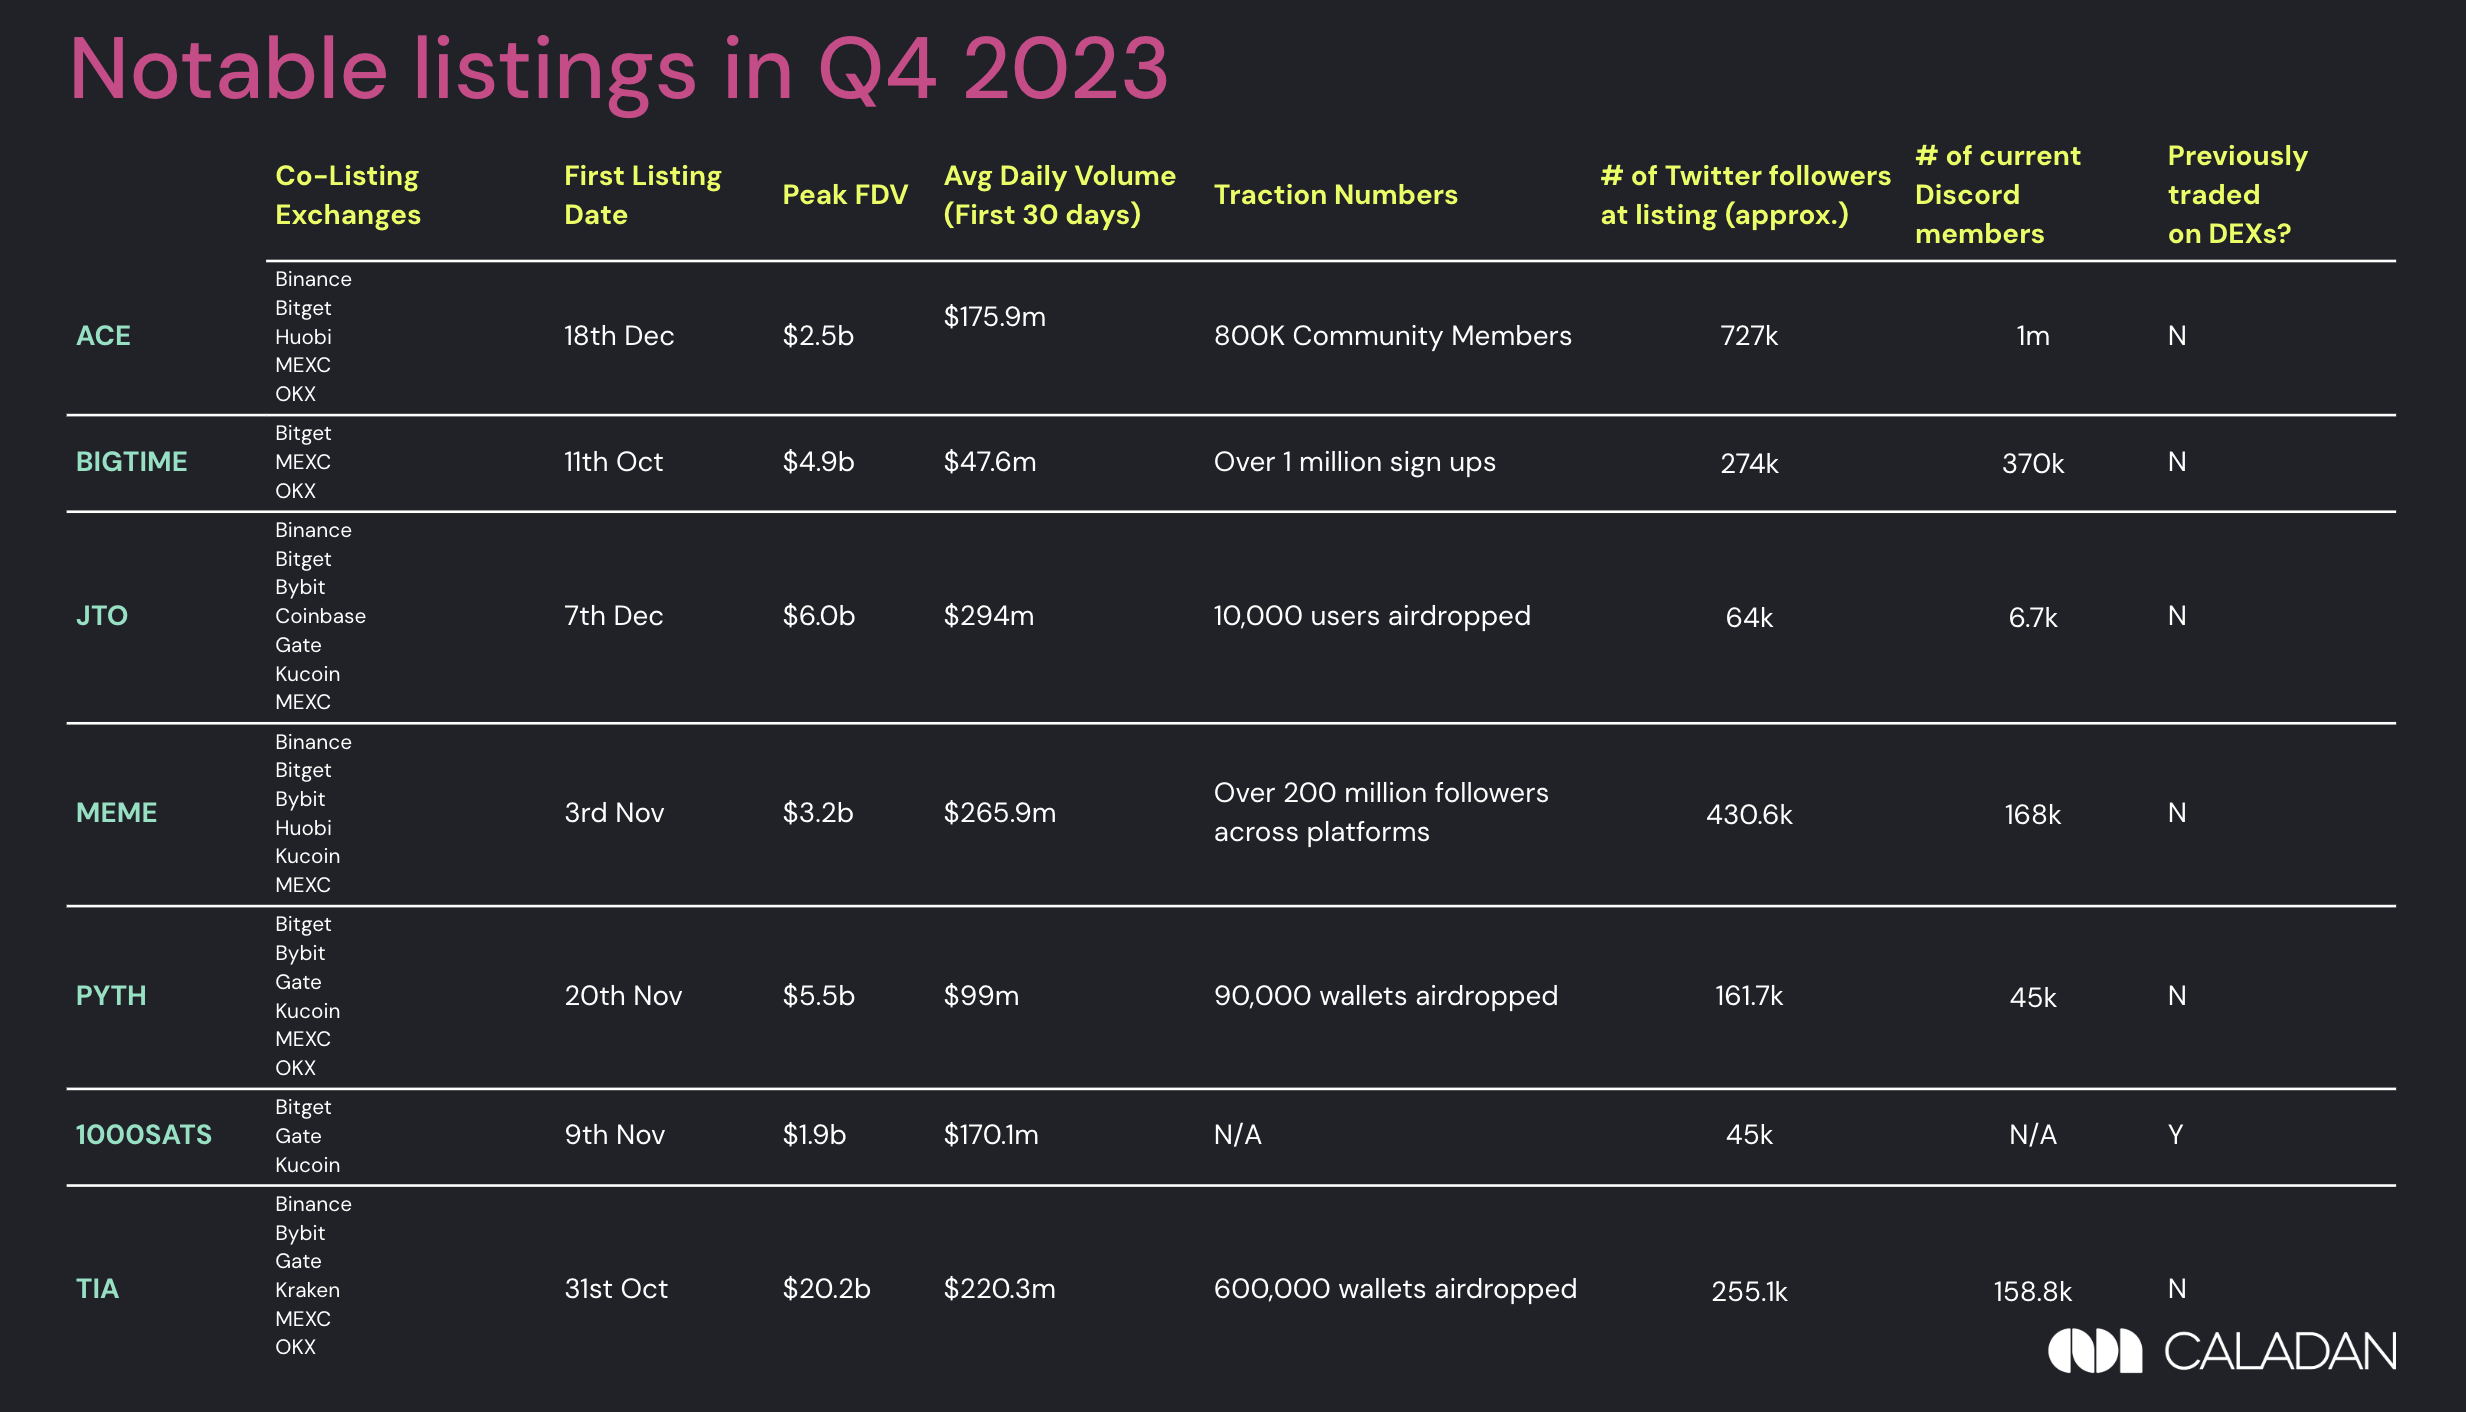
Figure 7: Comparison stats for Notable Listings in Q4
*Neutron and Ordinals were not included as they were already listed on other exchanges before this quarter
We chose the most notable tokens based both on peak FDV and the ones listed by top exchanges; as well as the amount of community engagement, general reception and interest. There is quite bit of variation in their engagement numbers depending on their protocol type, particularly if it was consumer facing, as well as how much money they had raised.
- Celestia, the leading modular blockchain stack, launched mainnet simultaneously, and conducted an airdrop to active users on Ethereum Layer 2s, stakers on Cosmos Hub and Osmosis. While $TIA started trading at a lower price, momentum grew and mostly held through to the new year.
- The Solana ecosystem performed strongly with $JTO and $PYTH. $PYTH, one of of the main oracles for the ecosystem, offering real-time market data and cross-chain compatibility had quite a bit traction with validators, so they started their listing strong. The price of $JTO and $BONK both pumped as their listing coincided with the BTC high of $43K.
- First $MEME had a private sale that sold out $28 million in only 28 hours, before Binance announced a Launchpool, enabling investors to stake to farm $MEME by staking BNB, TUSD or FDUSD. With these activities, $MEME started off strong, before falling and making a couple of rallies.
- While gaming tokens have not been as popular during the bear market, $BIGTIME, an NFT game token was listed by Coinbase. Considering the Coinbase rarely lists altcoins, there was a bit of price spike, before settling down.
a. Volume Performance
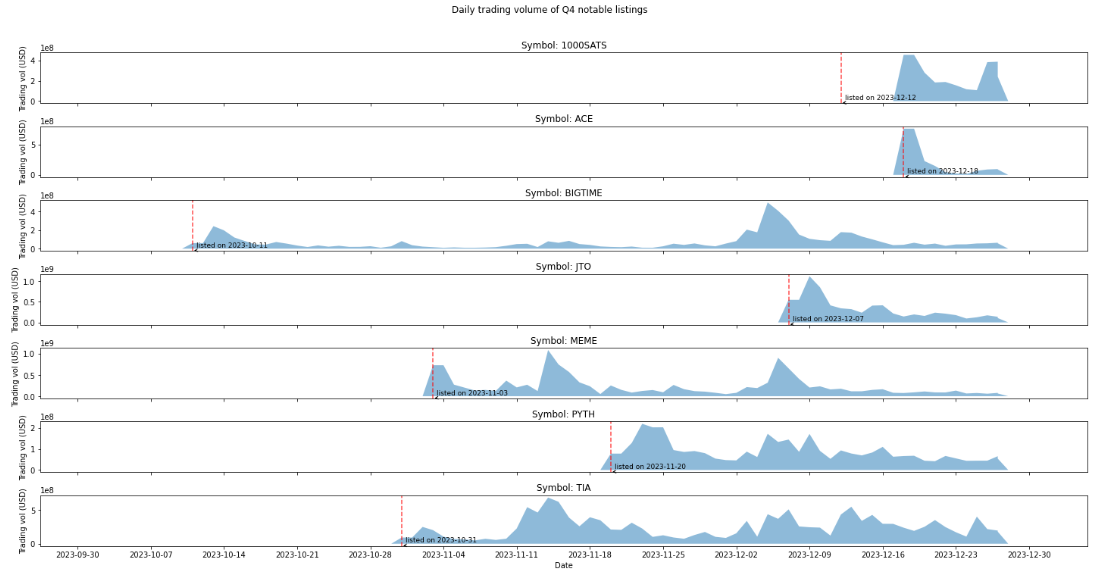
Figure 8: Daily Trading Volume of Q4 Notable Listings
- As illustrated in the chart, most tokens had a hyped start to their listing, seeing trading volumes being front loaded at point of listing which then gradually tapered off.
- The exception is BIGTIME, MEME and TIA, which saw trading volumes increase post listing.
b. Liquidity Performance
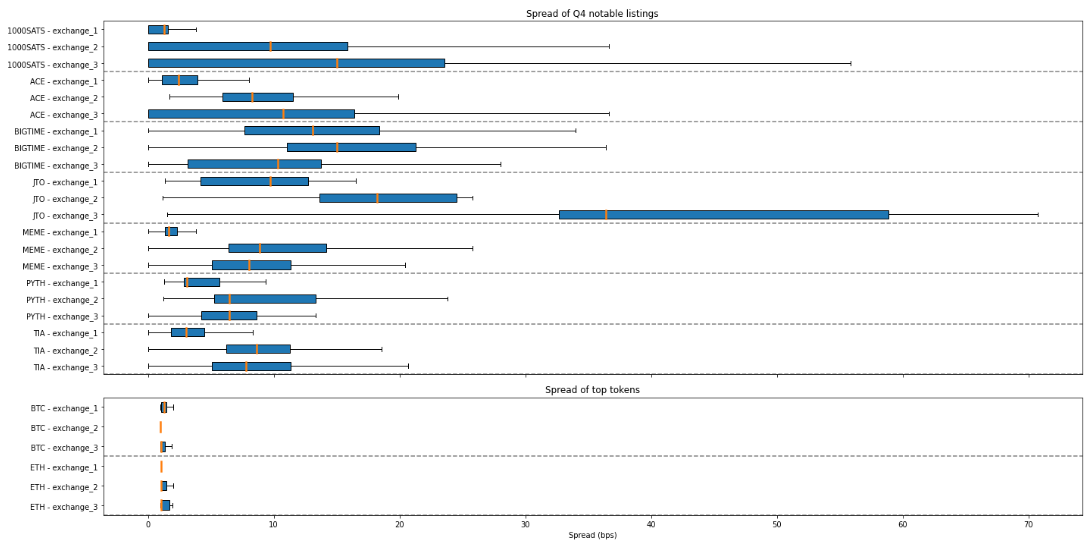
Figure 9: Spread of Notable Listings in Comparison to BTC and ETH
- Notable tokens traded at typical spreads of 5-15bps.
- JTO and 1000SATS had exceptionally wide spreads in its #2 and #3 exchanges, which indicate opportunities for market maker intervention.
- Amongst the tokens PYTH and TIA seems to trade at consistently tight spreads across its top 3 exchanges, likely buoyed by market marker support.
- In comparison to the top tokens of BTC and ETH, there exists a wide gap in liquidity performance as they trade at a spread of < 5 bps.
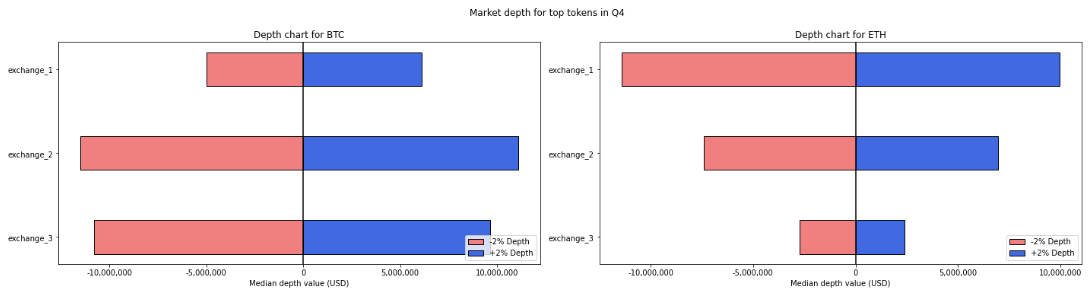
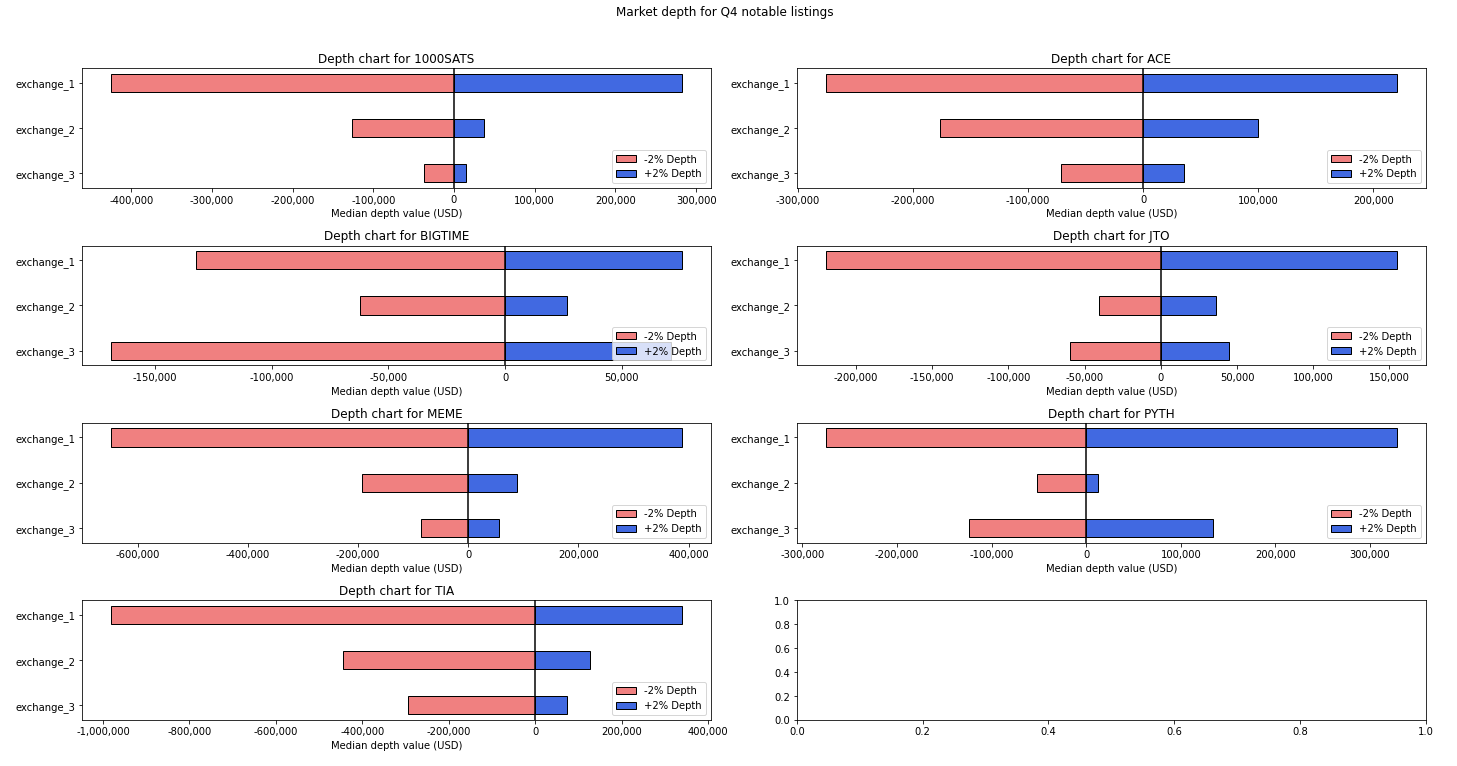
Figure 10: Depth Charts for Notable Listings in Comparison to BTC and ETH. (Note the different magnitude of x-axis scale)
- Across the board, liquidity is concentrated in a select few exchanges, with a significant drop off in market depth even for 2nd players (+/- 2% depth), with the exception of BIGTIME.
- In comparison, the drop off is not as significant across each of the top exchanges of top tokens (BNB being the exception, as it is Binance’s native token).
c. Price Movement
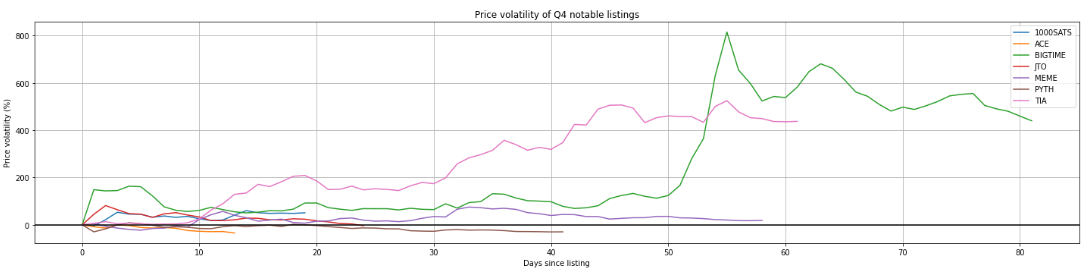
Figure 11: Price volatility of Q4 notable listings
- Q4 saw a mix in terms of price action for the list of notable tokens, with some underperformers and some overperformers.
- Notably, TIA and BIGTIME significantly outperformed their peers, as well as the broader market, even after adjusting for the market uptick in the quarter.
- PYTH and ACE underperformed, experiencing a continued price dip since their token listings.
Conclusion
Several developments in Q4 of 2023 (such as the Bitcoin spot ETF, regulatory clarity and liquidity injection via airdrops) contributed greatly to the warming sentiment and rising volumes across exchanges for listings and trading. We’ve seen both CEX and DEX volumes nearly double from their lows in Q3 2023 while market share continues to redistribute away from leaders as new narratives emerge.
New upcoming ecosystems will be interesting to watch, as the resurgence of the Solana ecosystem draws attention towards new blockchain competitors and renewed onchain activity – such as on Move (Aptos, Sui) and Cosmos (Celestia, Injective, etc) ecosystems. Recent airdrops like Jito have also been highly lucrative. We expect to see more of such airdrops in 2024, as projects building through the bear market capitalise on the returning attention to the crypto market and launch on mainnet.
