Table of Contents
The State of Liquidity Report is a quarterly report that offers valuable insights on the past quarter’s market listings and liquidity landscape. It covers overall market trading trends, volumes and volatility, token listing and delisting activity, and insights on notable listings during this period. This report may be useful for projects that are looking to launch their own token in the near future, projects that are already listed, as well as investors and other market participants.
All the data used in this report is collected from publicly available sources.
Executive Summary
The overall crypto market continues to trade at muted volumes, possibly due to macro investor sentiment and regulatory uncertainties. While trading volumes have slowly started to shift away from Binance, there is still a lot of concentration on top exchanges, both centralised and decentralised. Even though major exchanges are still listing new tokens, the...
Deeper Insights Ahead
Table of Contents
The State of Liquidity Report is a quarterly report that offers valuable insights on the past quarter’s market listings and liquidity landscape. It covers overall market trading trends, volumes and volatility, token listing and delisting activity, and insights on notable listings during this period. This report may be useful for projects that are looking to launch their own token in the near future, projects that are already listed, as well as investors and other market participants.
All the data used in this report is collected from publicly available sources.
Executive Summary
The overall crypto market continues to trade at muted volumes, possibly due to macro investor sentiment and regulatory uncertainties. While trading volumes have slowly started to shift away from Binance, there is still a lot of concentration on top exchanges, both centralised and decentralised. Even though major exchanges are still listing new tokens, the number has slowed. Delistings have also occurred, indicating the importance of maintaining token performance to avoid being delisted.
Notable listings in Q3 included tokens like SEI, CYBER, WLD, ARKM, MNT, and PENDLE. SEI stood out as the only token that has managed to sustainably beat the broader market by maintaining a premium on its list price, while MNT has grown substantially in terms of volume since launch.
1. Overall crypto market
Centralised / Decentralised Trading Activity
Figure 1: Top 15 CEXs and Top 5 DEXs from CoinMarketCap Ranking
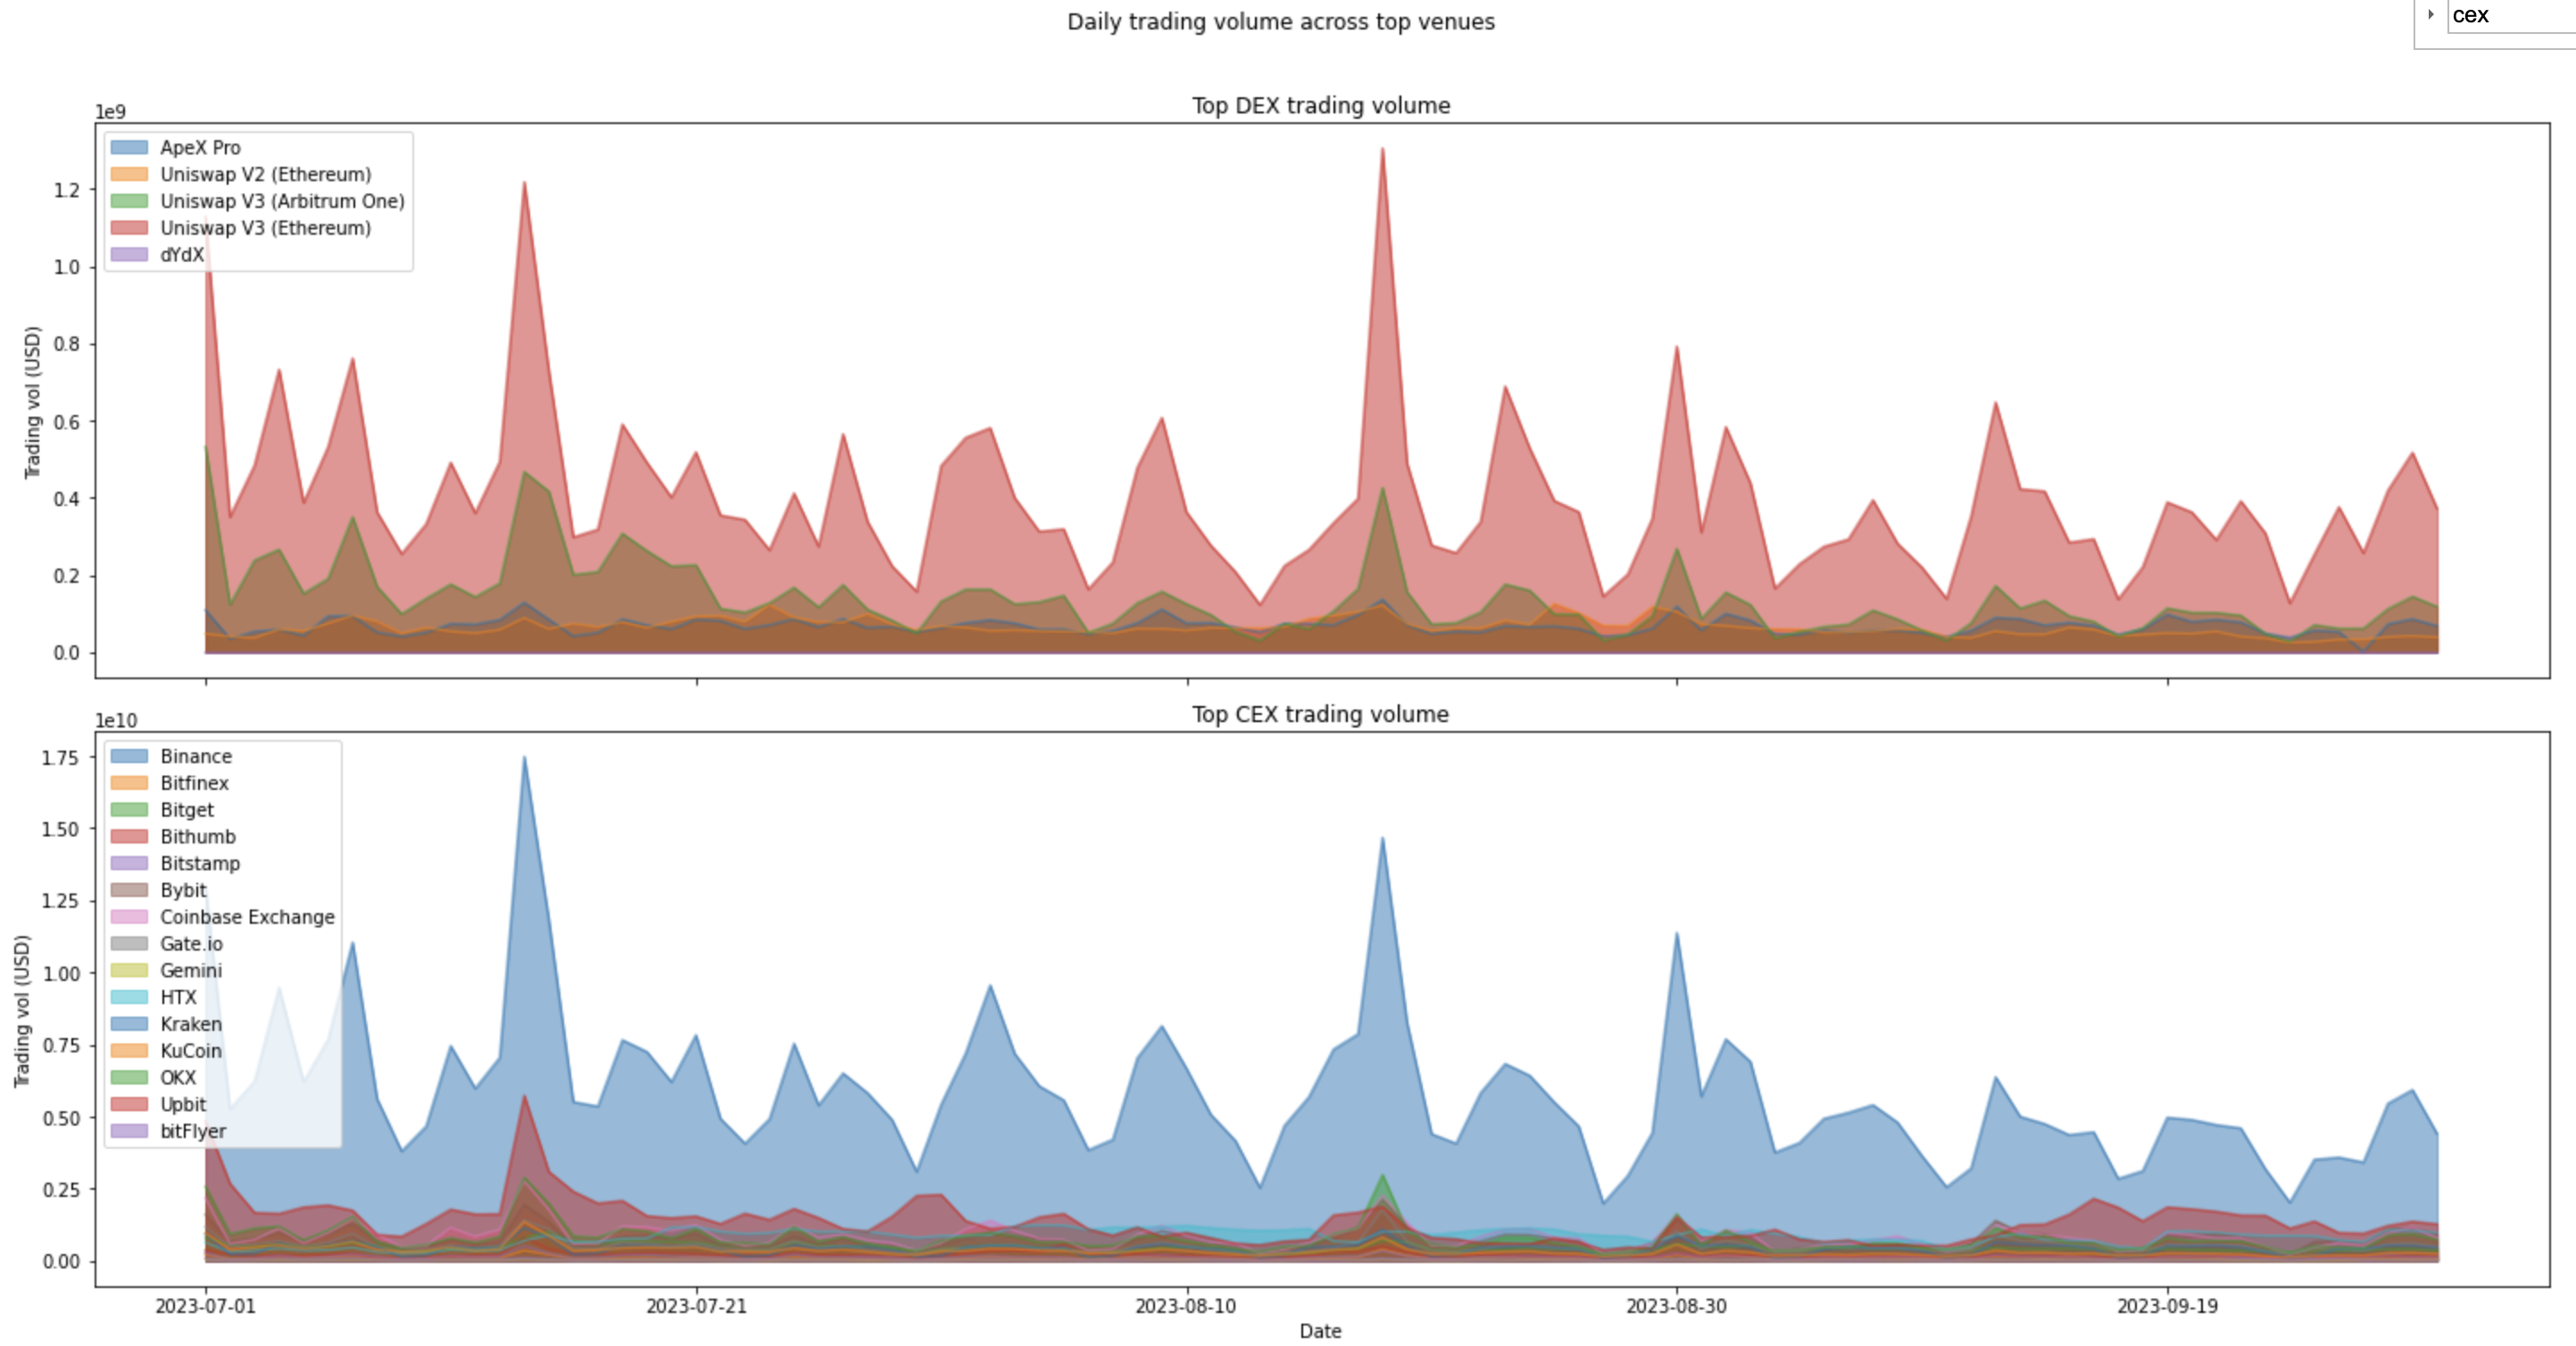 Figure 1:
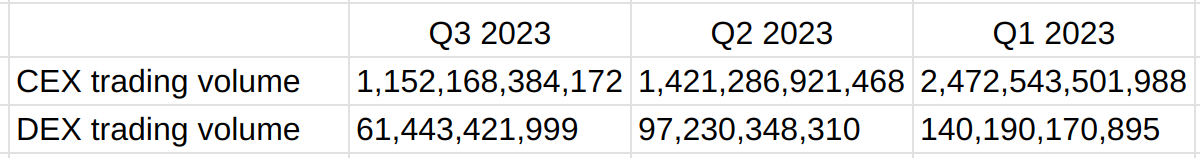
Figure 2: This aggregated trading volume from Top 15 CEXs and Top 5 DEXs from CoinMarketCap, not total volume overall, and is meant to be context for Figure 1.
- Q3 volumes are down 18.9% from the previous quarter for CEXs and 36.8% for DEXs.
- Trading activity on centralised exchanges is 18.7 times greater than that on decentralised venues. Despite increased regulatory scrutiny on centralised exchanges, we see no observable sustained migration of trading volume from off-chain to on-chain exchanges.
- Overall market continues to trade at muted volumes despite Ethereum Futures ETF listing.
- There has also been a slow down in cadence of new entrants, with no new exchange breaking into the top band of incumbents.
- Binance market share continues dropping for seven months in a row, now 34.3% of spot market down from 55% in Jan 2023. We’ve seen recent gains in market share for Upbit, MEXC, Bybit, Crypto com and Bullish.
Token Listing and Delisting activity

Figure 3: Frequent Listers (101 or more listings per quarter)*
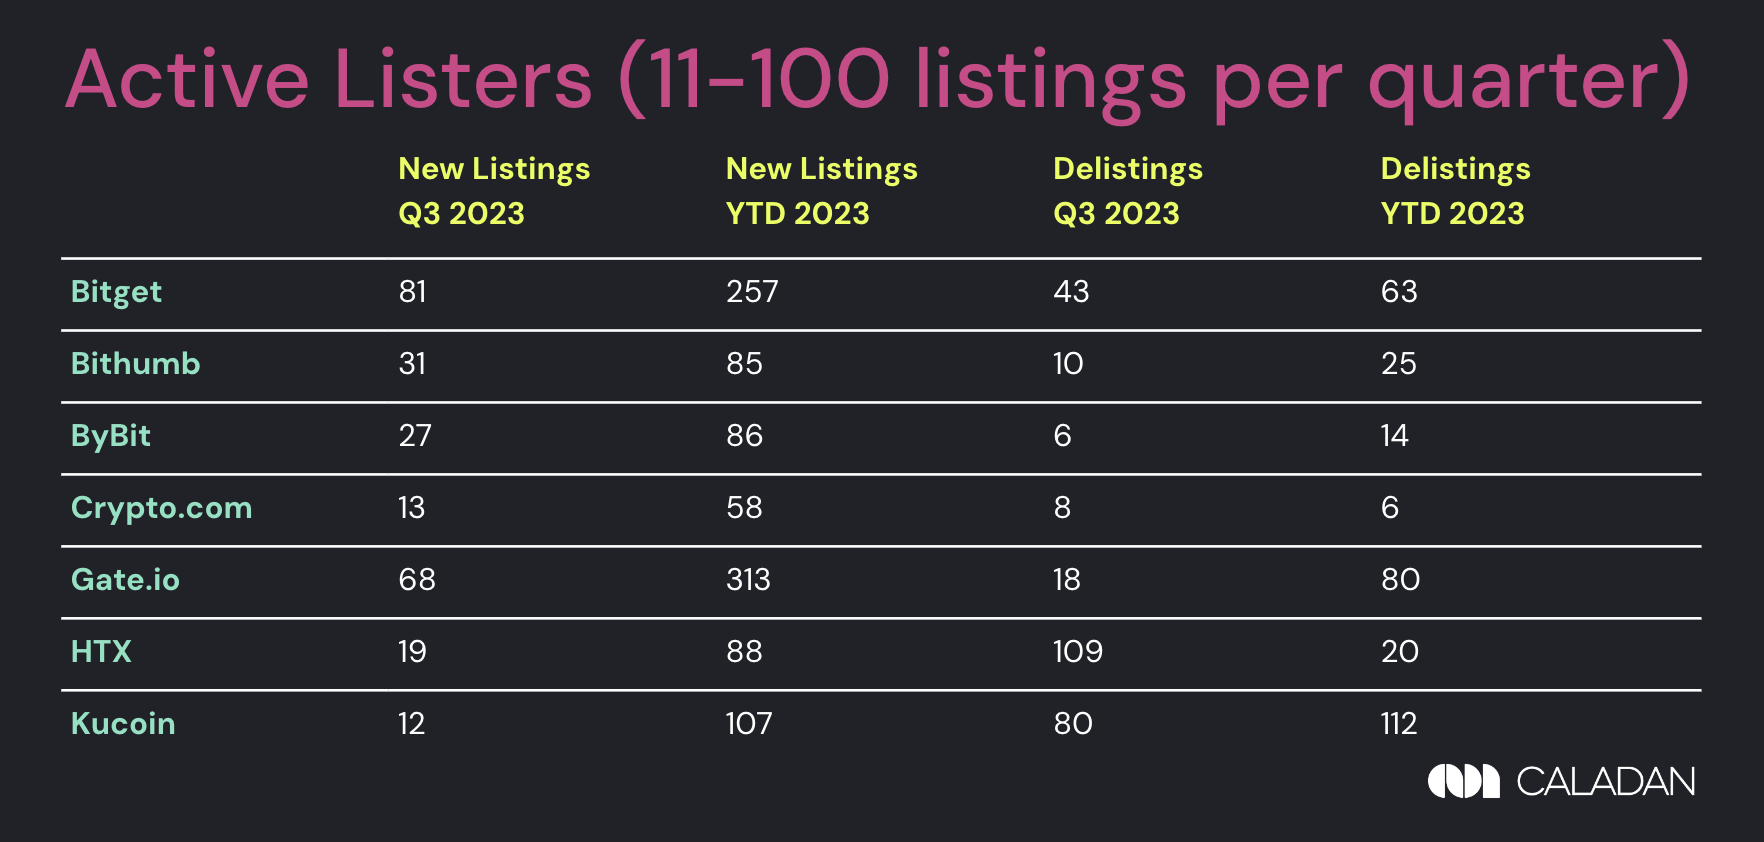
Figure 4: Active Listers (11-100 listings per quarter)*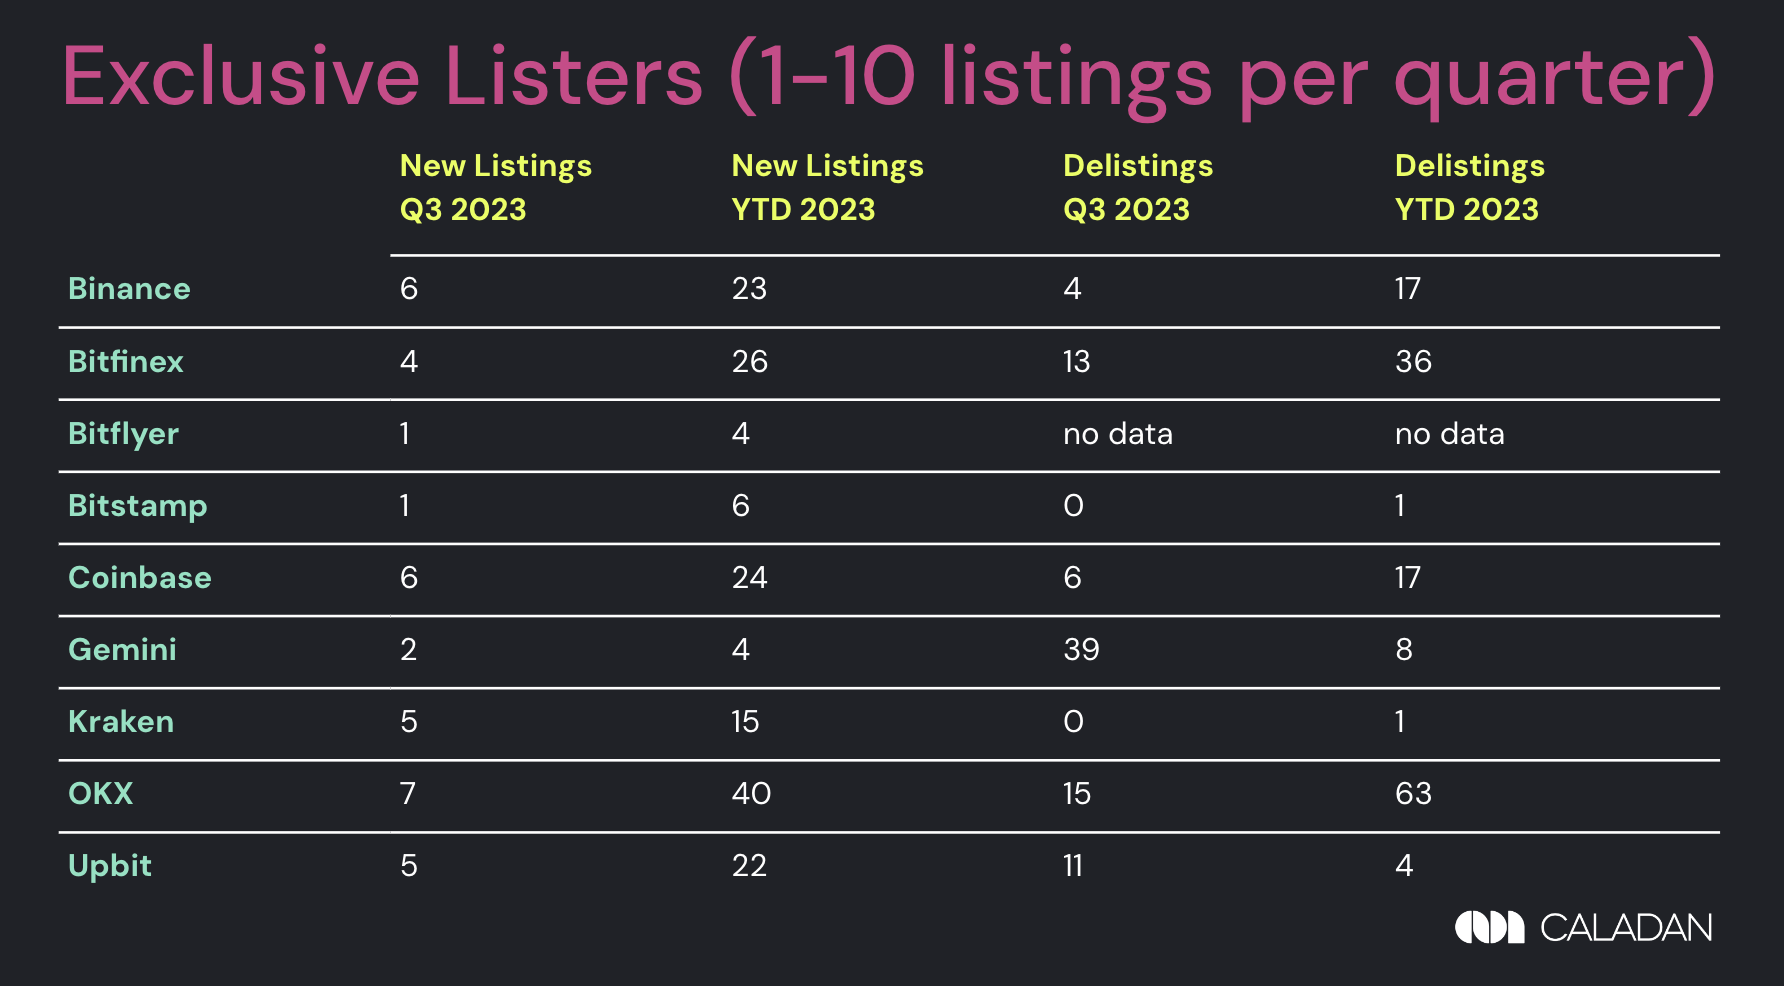
Figure 5: Exclusive Listers (1-10 listings per quarter)*
*CoinMarketCap Top 15 by trust score, with the addition of MEXC, as this is a common exchange for new listings. Data on previous listings are pulled from various data feeds and cross checked against exchange websites and Twitter.
State of Liquidity on Top 1000 Tokens (ranked by ADV)
To provide an overview of the overall state of market liquidity, we survey the top 1000 tokens as listed on CoinMarketCap and detail liquidity metrics across their top 3 exchange venues.
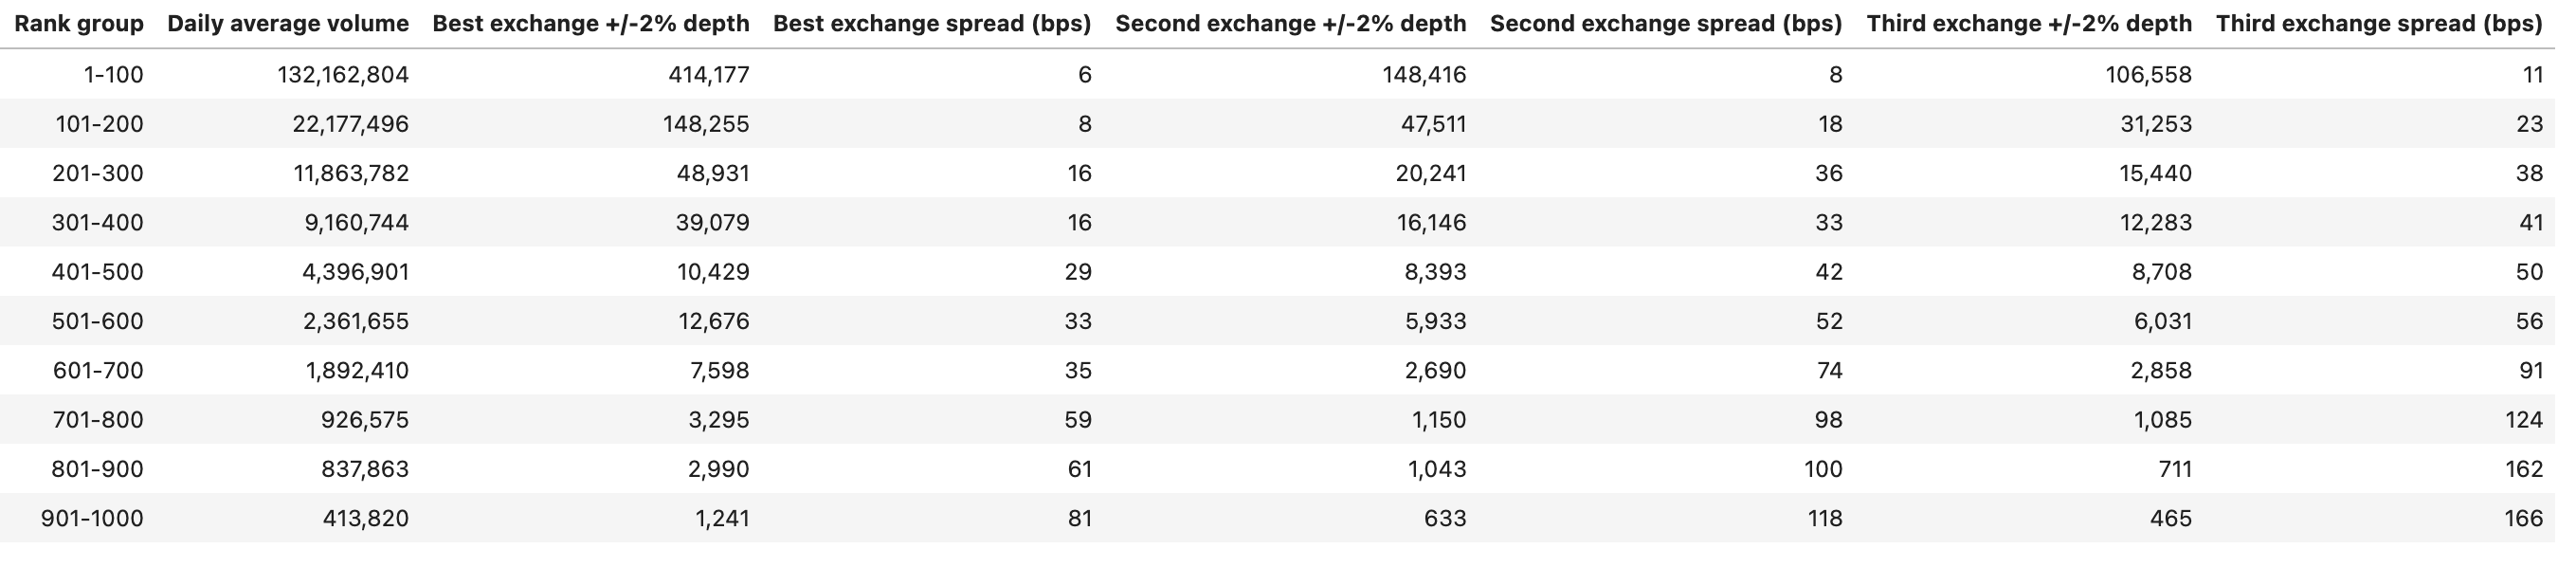
Figure 6: Top 1000 tokens ranked by volume of top performing exchange
- Liquidity is heavily concentrated in the top 100 tokens. This is demonstrated in terms of (1) daily trading volumes, (2) market depth and (3) spread across the top 3 exchanges for the tokens.
- Due to a lack of overall participants in the current market environment, we observe a flight to “quality” tokens that is further bolstered by institutional support.
2. Insights on Q3 notable listings
Notable listings in Q3 2023
Binance listed 6 coins this quarter, and with the exception of $FDUSD, we have all considered them notable here. Certainly the coin with the most buzz was WorldCoin ($WLD), which announced a $115 million dollar raise earlier in the year. Their enormous marketing budget, which included numerous global offline activations, particularly those in emerging markets and non-crypto-native areas, helped drive the high retail interest.
Pendle, being a DeFi protocol themselves, chose to list on DEXs first, but still listed on Binance as well in July 2023.

Figure 7: Comparison Stats for notable listings
We chose the most notable tokens based both on peak FDV, the ones listed by top exchanges, as well as the amount of community engagement, general reception and interest. There is quite bit of variation in their engagement numbers depending on their protocol type, particularly if it was consumer facing, as well as how much money they had raised.
Volume performance
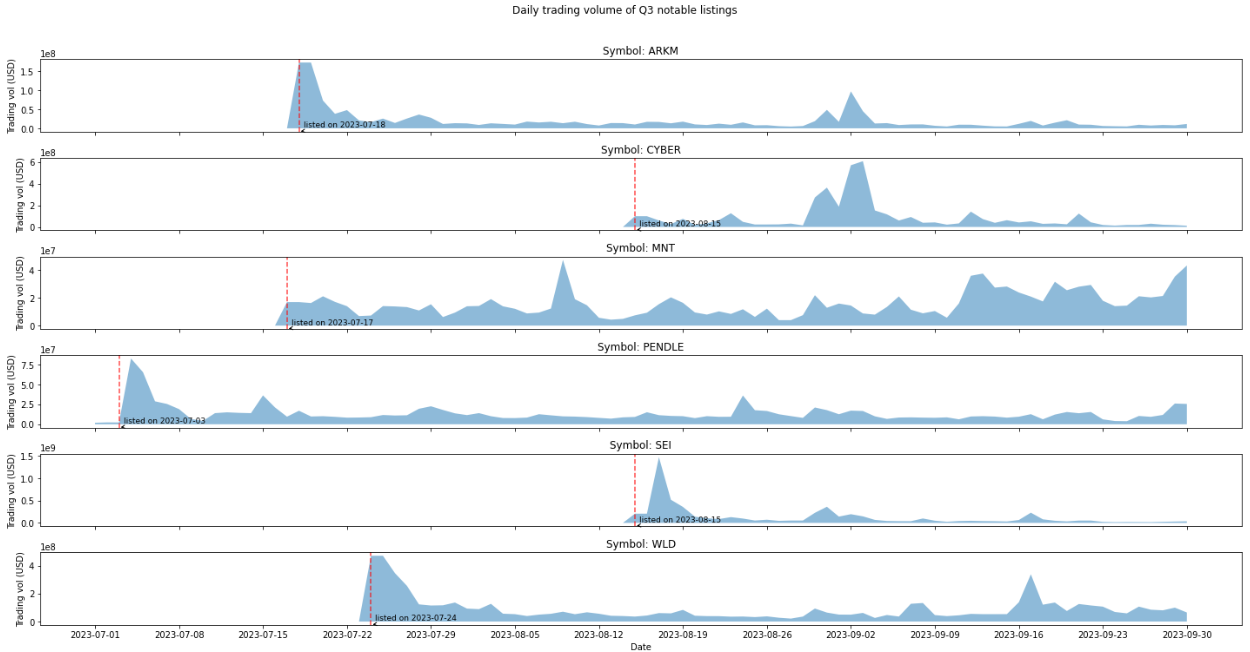
Figure 8: Daily Trading Volume of Q3 Notable Listings
- Even among notable listings, most projects experienced an initial hype at time of listing, but quickly tapered down in terms of trading volume.
- The exception is MNT, which has seen a gradual increase since listing as it continues to grow its ecosystem, providing quality yield sources for Real World Assets (RWAs) and ensuring deep liquidity through a bootstrap proposal for its treasury.
- ARKM, PENDLE, SEI and WLD traded with much fanfare in the beginning, but have since lost volume momentum, as a reflection of the market sentiment to capture initial price action that didn’t follow through the quarter.
Liquidity performance
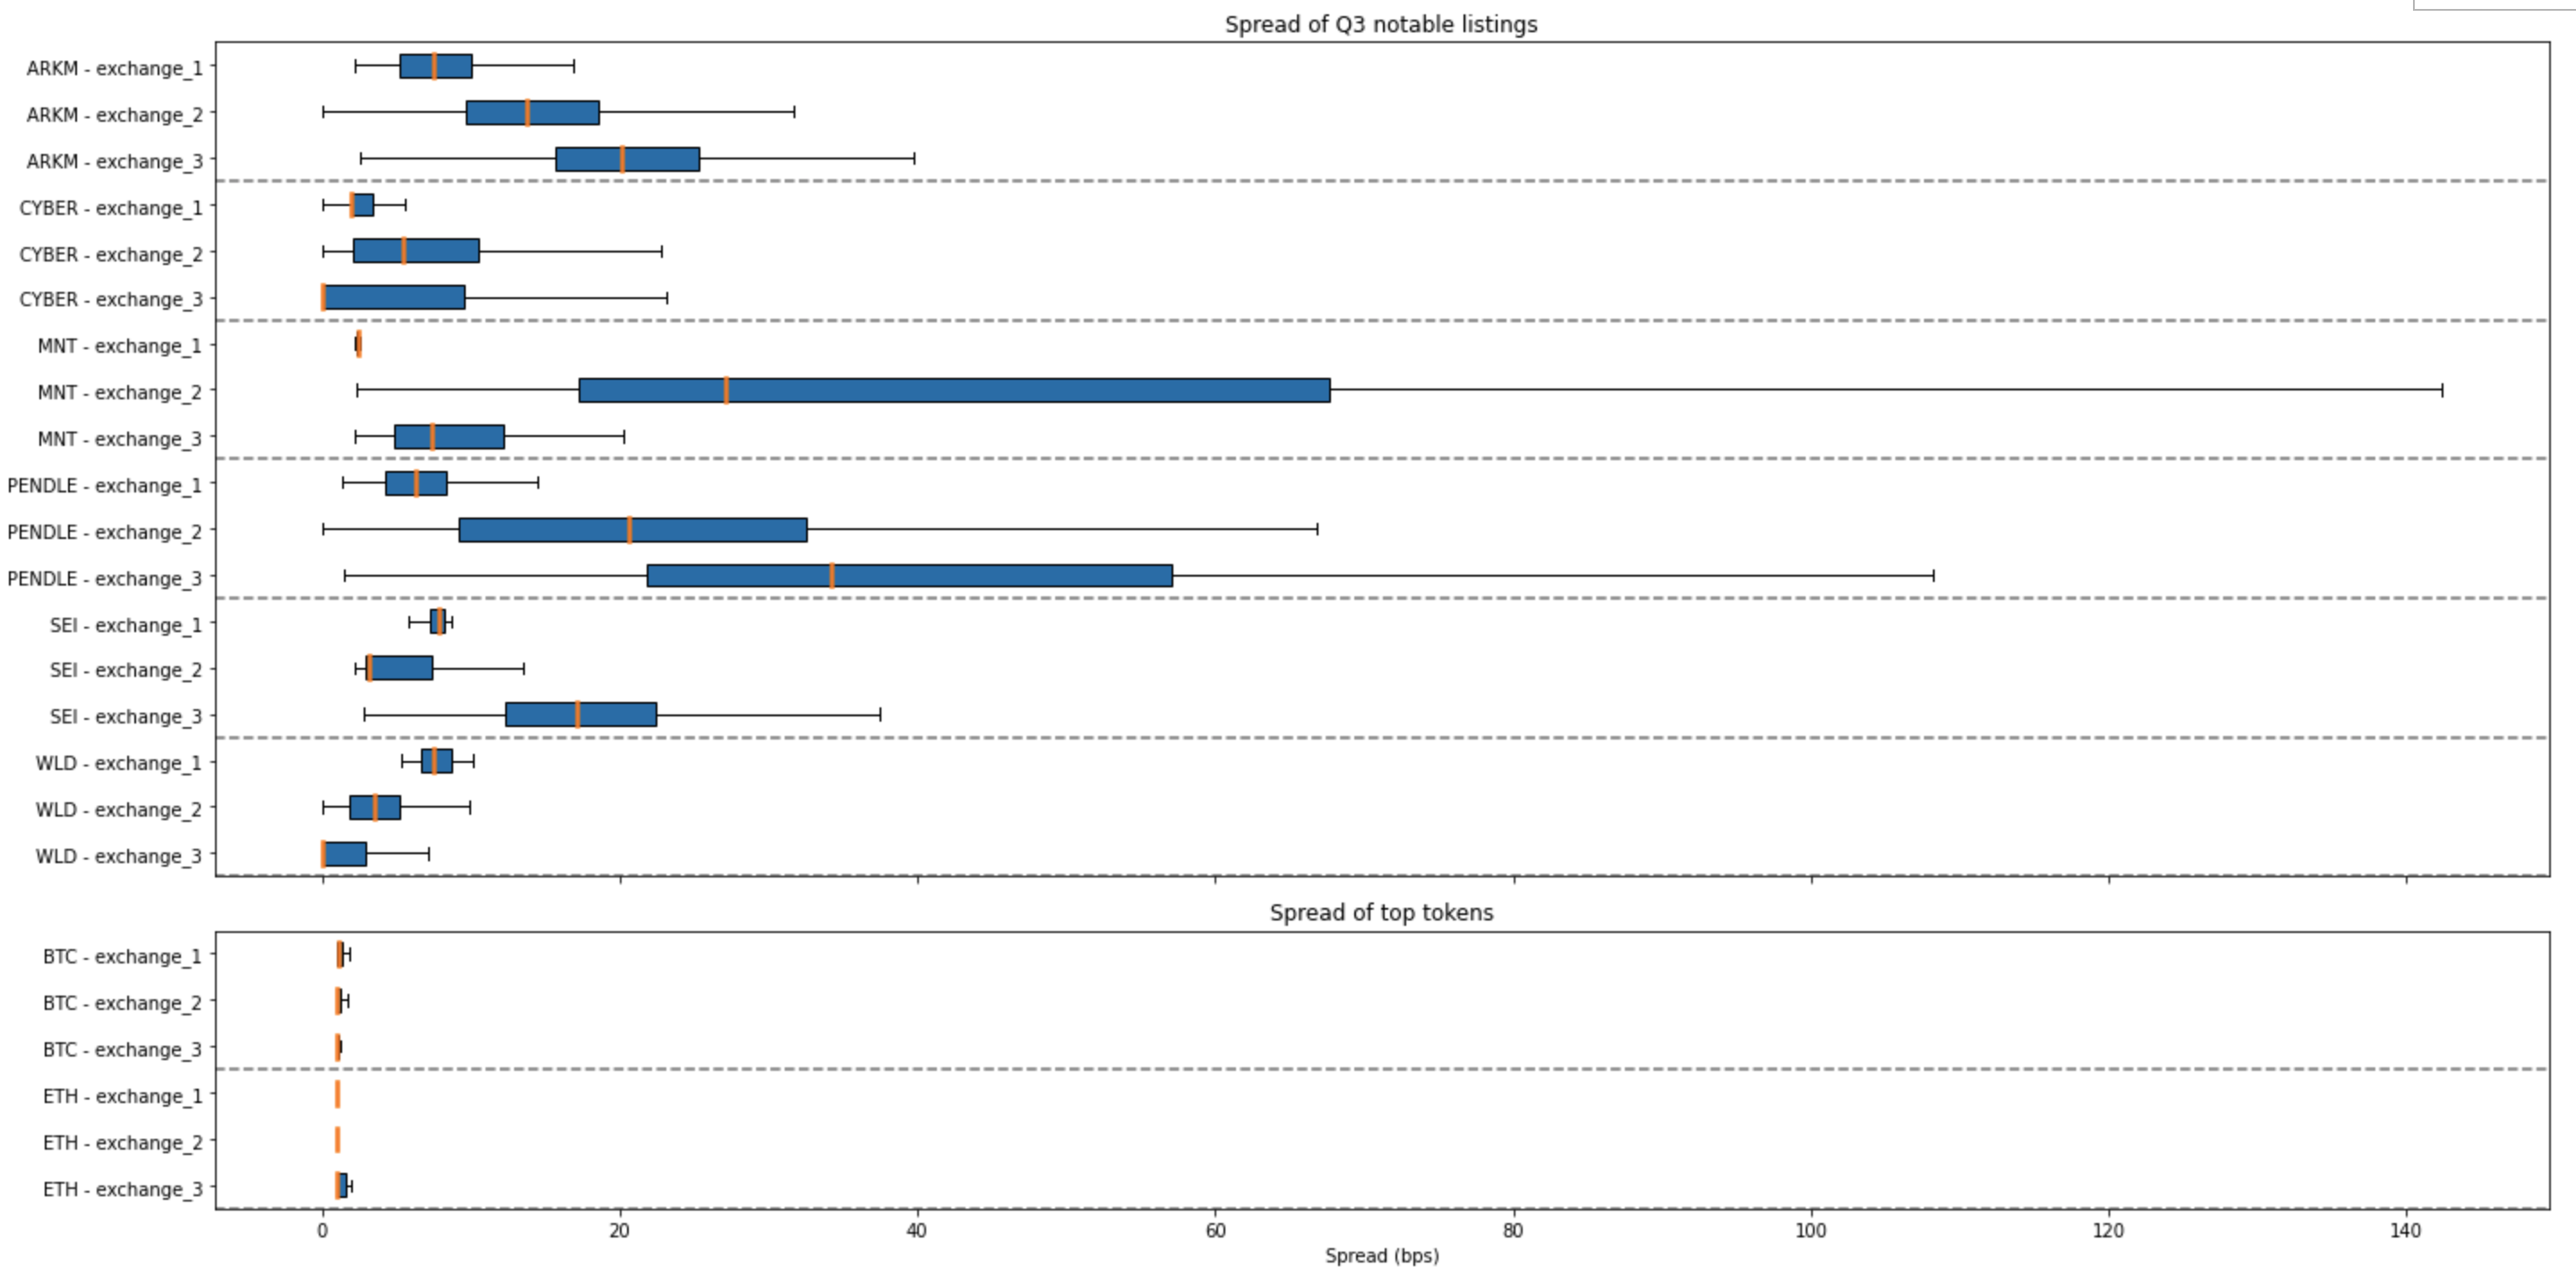
Figure 9: Spread of Notable Listings in Comparison to BTC and ETH
- Notable tokens traded at typical spread of < 40bps in Q3
- MNT and PENDLE had exceptionally wide spreads in their #2 and #3 exchanges, which indicate opportunities for market maker intervention.
- Amongst the tokens WLD seems to trade at tightest spreads, likely buoyed by market marker support.
- In comparison to the top tokens of BTC and ETH, there is a wide gap in liquidity performance as they trade at a spread of < 10 bps.
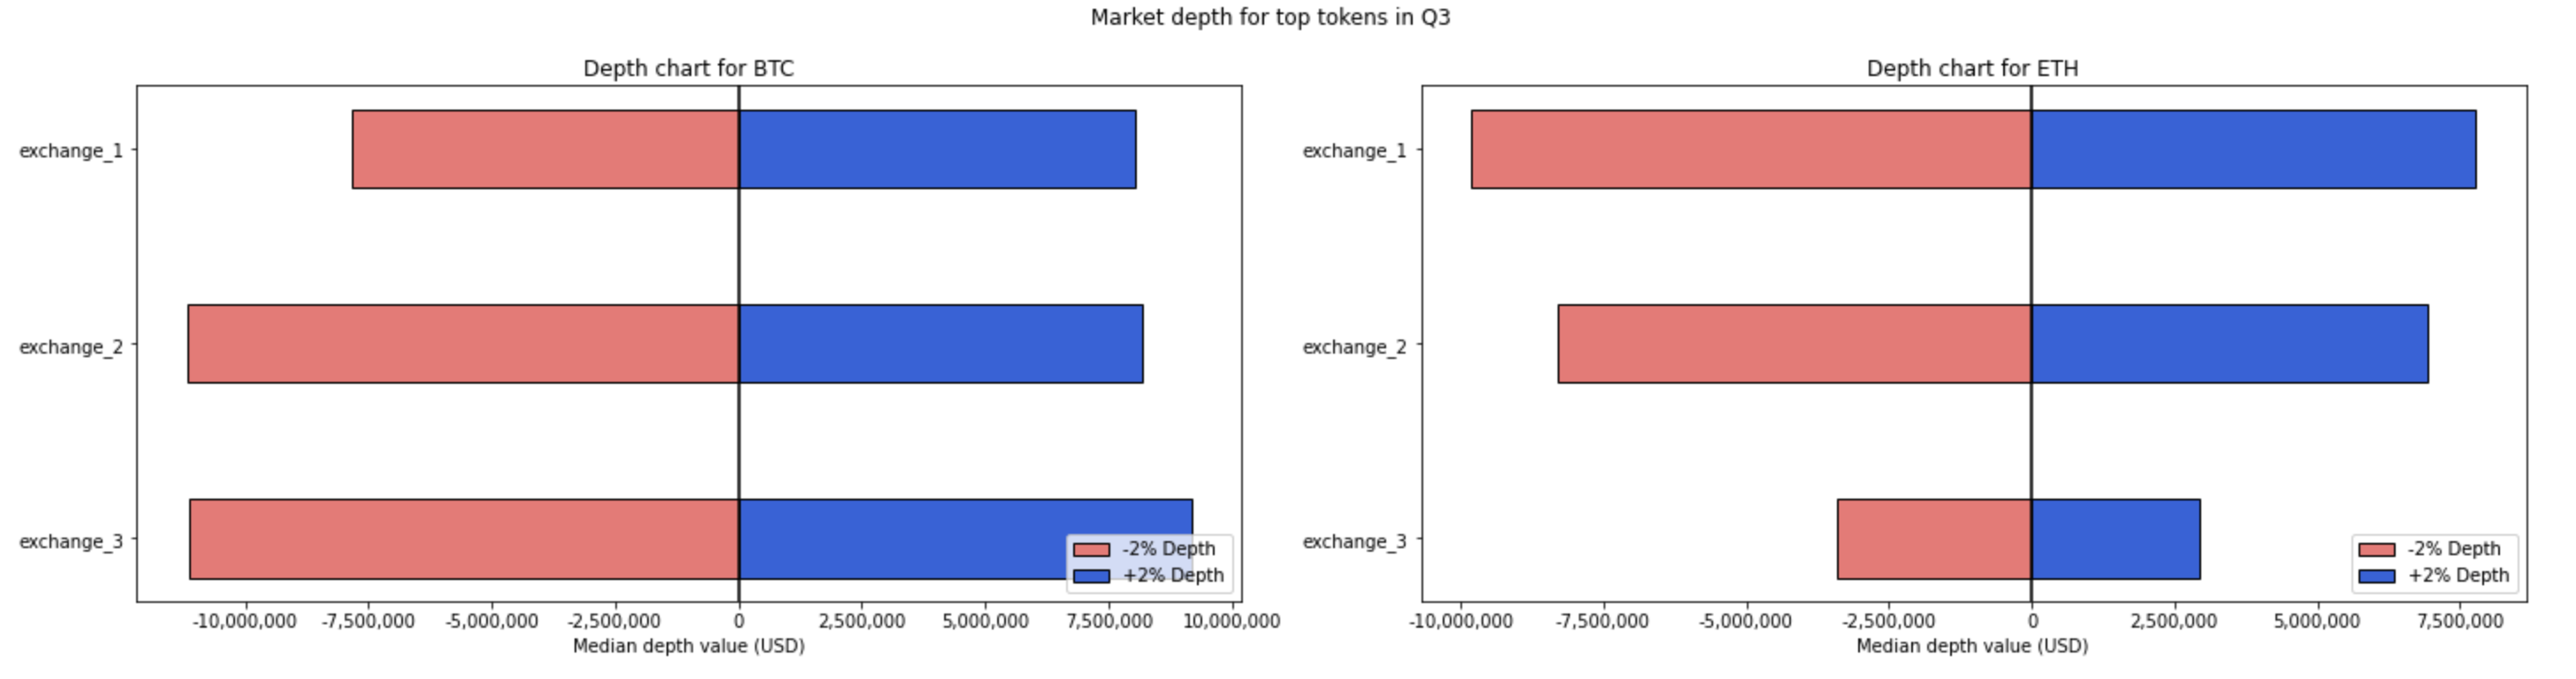
Figure 10: Depth Charts for Notable Listings in Comparison to BTC and ETH. Please note the x-axis scale, as BTC and ETH have significantly more depth.
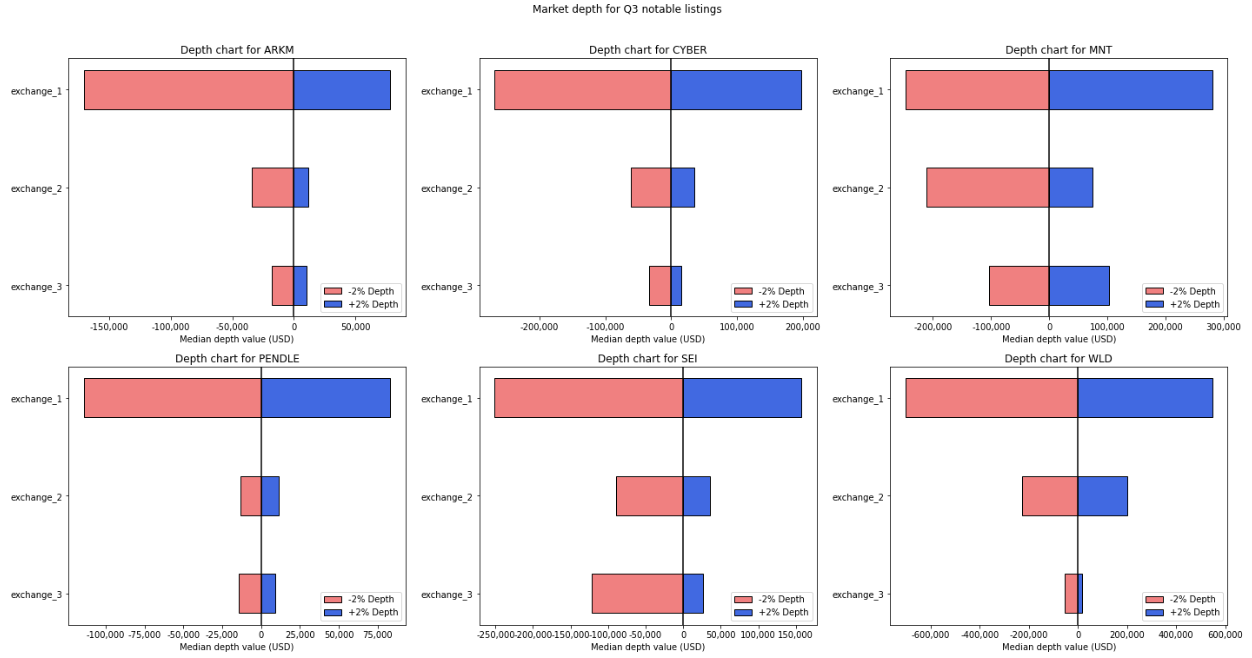 Figure 10: Depth Charts for Notable Listings in Comparison to BTC and ETH. Please note the x-axis scale, as BTC and ETH have significantly more depth.
- Across the board, liquidity is concentrated in a select few exchanges, with a significant drop off in market depth even for 2nd players (+/- 2% depth)
- In comparison, the drop off is not as significant across each of the top exchanges of top tokens (BNB being the exception, as it is Binance’s native token.)
Price Movement
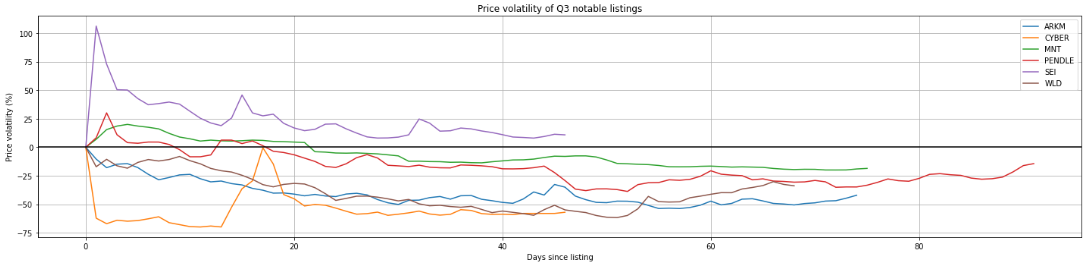
Figure 11: Price volatility of Q3 notable listings
- In general, most tokens see a drop in price from initial listing price, indicating a lack of sustained interest from the market
- The exception to the above is SEI, which saw an initial price uptick and ended the quarter floating above initial list price
- Only SEI, MNT and PENDLE saw a ~20% increase in trading price from list price, while CYBER and, ARKM and WLD experienced immediate and continued decrease in trading prices upon listing
- CYBER almost immediately began trading below listing price, because of a misallocation of number of initial tokens.
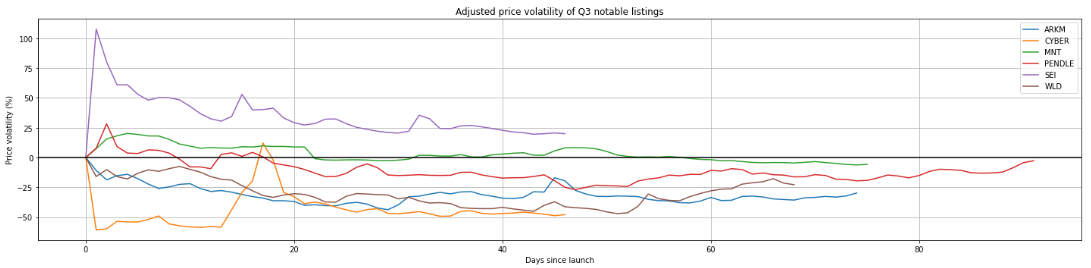
Figure 12: Index-adjusted price volatility of Q3 Notable Listings
- Adjusting for overall crypto market price performance (benchmarked against Coindesk Crypto Index), the general story above remains the same.
- SEI is the only token that has managed to sustainably beat the broader market by maintaining a premium on its list price.
Coming Up
In our next report, we will feature QoQ data about delisting and listing, as well as an adjusted view of the top exchanges for greater data accuracy.
