
Analysis of Solana’s protocol infrastructure, capital efficiency, and technical architecture
- Protocols Tracked: 139
- Evaluation Period: March 12 - July 9, 2025 (120-day assessment)
- Methodology: Multi-timeframe capital behavior analysis with technical infrastructure evaluation
Summary Statistics:
- Liquid staking dominance: $5.45B TVL (62.5% of overall Solana ecosystem)
- Capital efficiency leadership: 17.0% ecosystem volume/TVL ratio outperforms most L1s significantly
- Derivatives market presence: $720M daily volume representing 8.1% of global perpetual trading activity
- Technical infrastructure advantages: Sub-second finality enables sophisticated protocol implementations unavailable on slower chains
- Market concentration patterns: Top 5 DeFi protocols control 75% TVL but include diverse categories, reducing single-point risks
- Cross-chain capital flows: $2.52B bridge TVL (28.9% of ecosystem) indicates substantial multi-chain integration
Assessment Implications:
- Solana demonstrates technical maturity supporting advanced DeFi strategies through architectural advantages
- Capital allocation...
Deeper Insights Ahead
Analysis of Solana’s protocol infrastructure, capital efficiency, and technical architecture
- Protocols Tracked: 139
- Evaluation Period: March 12 – July 9, 2025 (120-day assessment)
- Methodology: Multi-timeframe capital behavior analysis with technical infrastructure evaluation
Summary Statistics:
- Liquid staking dominance: $5.45B TVL (62.5% of overall Solana ecosystem)
- Capital efficiency leadership: 17.0% ecosystem volume/TVL ratio outperforms most L1s significantly
- Derivatives market presence: $720M daily volume representing 8.1% of global perpetual trading activity
- Technical infrastructure advantages: Sub-second finality enables sophisticated protocol implementations unavailable on slower chains
- Market concentration patterns: Top 5 DeFi protocols control 75% TVL but include diverse categories, reducing single-point risks
- Cross-chain capital flows: $2.52B bridge TVL (28.9% of ecosystem) indicates substantial multi-chain integration
Assessment Implications:
- Solana demonstrates technical maturity supporting advanced DeFi strategies through architectural advantages
- Capital allocation patterns (into liquid staking) indicate network security prioritization rather than speculative trading focus
- Protocol diversity provides multiple approaches within each DeFi category enabling risk distribution
- Volume efficiency metrics suggest superior capital deployment compared to other L1 implementations. Every $1 of locked capital generates $0.17 of daily trading volume on Solana, whilst other L1s only generate $0.03-0.08 of volume per $1 locked.
Section 1: Liquid Staking Protocol Infrastructure Assessment
1.1 Capital Allocation Framework Analysis
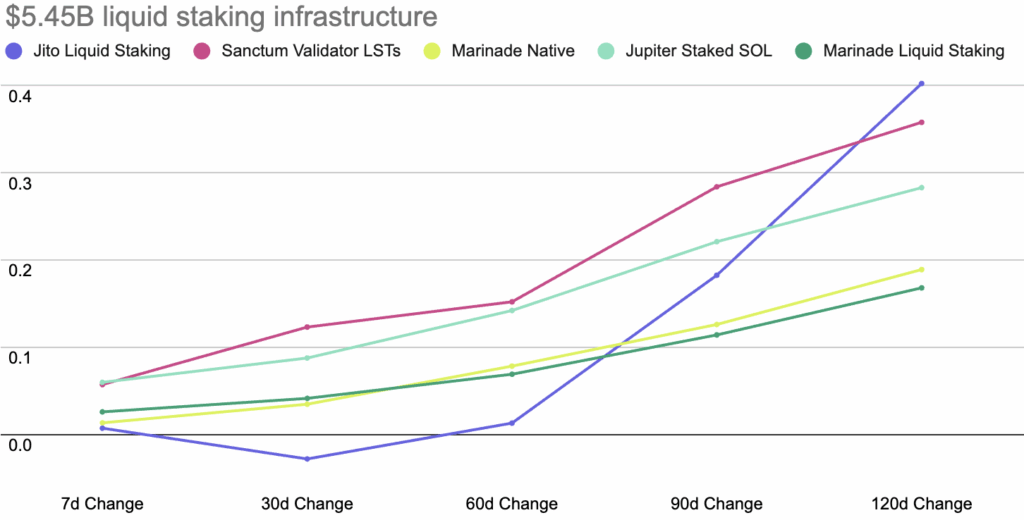
| Protocol | TVL | 7d Change | 30d Change | 60d Change | 90d Change |
| Jito Liquid Staking | $2.68B | +0.70% | -2.83% | +1.28% | +18.25% |
| Sanctum Validator LSTs | $1.60B | +5.70% | +12.3% | +15.2% | +28.4% |
| Marinade Native | $809M | +1.31% | +3.45% | +7.82% | +12.6% |
| Jupiter Staked SOL | $789M | +5.96% | +8.75% | +14.2% | +22.1% |
| Marinade Liquid Staking | $760M | +2.57% | +4.12% | +6.89% | +11.4% |
MEV integration drives competitive positioning and yield enhancement
Solana’s liquid staking sector’s 62.5% TVL concentration and support of over 1500 validators across different protocols represent network security participation as the primary value proposition rather than higher-risk/higher-reward DeFi strategies and/or concentrated speculation.
Further, said sector also shows consistent positive TVL growth (18-40% over 120 days) rather than volatile speculative spikes, substantiating this thesis.
Jito’s MEV integration captures additional yield streams (15-25% over base staking) through validator-level value extraction, explaining market position despite competitive alternatives.
Sanctum’s validator marketplace architecture enables permissionless LST creation, supporting validator diversity while reducing single-operator risks.
1.2 Technical Innovation Assessment
Validator diversity and protocol competition enable risk distribution
Combined liquid staking infrastructure supports over 1,500 validators across different protocols, contributing to network decentralization while providing varying risk-return profiles.
The competitive landscape with five protocols exceeding $200M TVL provides sufficient diversification for risk management while maintaining innovation incentives across different technical approaches.
Section 2: Exchange Protocol Capital Efficiency Assessment
2.1 Trading Infrastructure Performance Analysis
Evaluated: $2.5B exchange protocol infrastructure
| Protocol | TVL | Daily Volume | Volume/TVL | 7d Change | 30d Change | 60d Change | AMM Model |
| Raydium AMM | $1.76B | $756M | 42.9% | +4.89% | +8.23% | +12.4% | Concentrated Liquidity V3 |
| Meteora DLMM | $556M | $89M | 16.0% | +1.94% | +3.87% | +6.12% | Dynamic Liquidity Market Maker |
| Meteora DAMM V1 | $67M | $12M | 17.9% | -3.28% | -1.45% | +2.34% | Stable Asset Specialization |
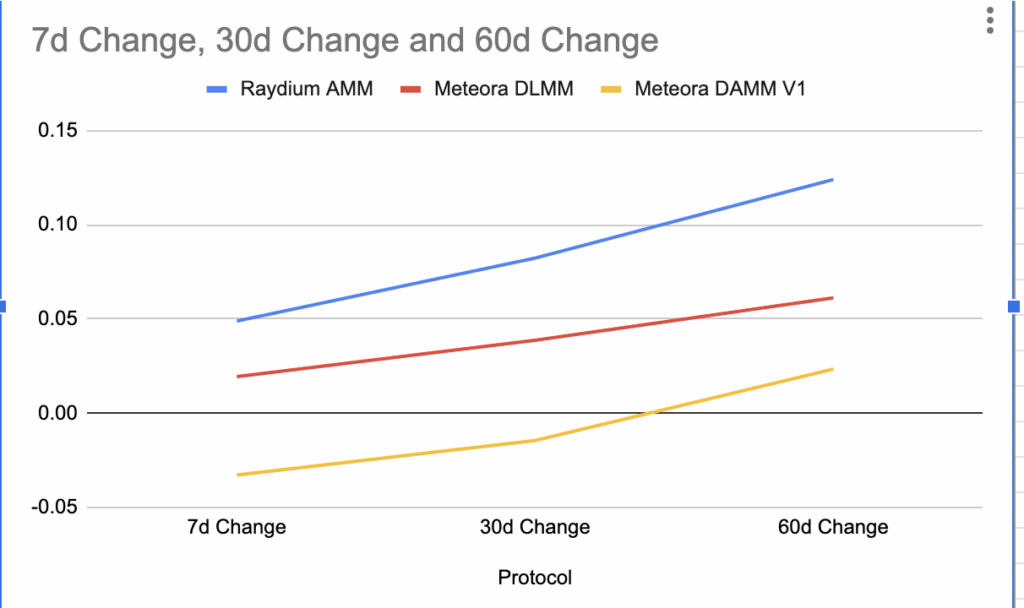
Volume concentration creates efficiency benefits but also introduces systematic risks
Raydium’s 42.9% volume/TVL ratio demonstrates exceptional capital deployment efficiency. The concentration of 80% exchange volume creates both efficiency benefits through reduced fragmentation costs, but also concentration considerations requiring risk management.
Meteora’s Dynamic Liquidity Market Maker achieves zero-slippage bin-based liquidity with dynamic fee adjustment providing automatic risk management.
2.2 Technical Architecture Impact
Sub-second finality enables sophisticated trading mechanisms
Solana’s sub-second finality enables sophisticated exchange architectures impractical on slower blockchains. Phoenix’s on-chain limit order book achieves spreads of just 0.1–0.5 basis points, approaching the efficiency of centralized exchanges.
Automated liquidity management protocols reduce capital requirements by approximately 60% versus traditional AMMs while maximizing fee capture.
Section 3: Lending Protocol Infrastructure Assessment
3.1 Credit Market Analysis
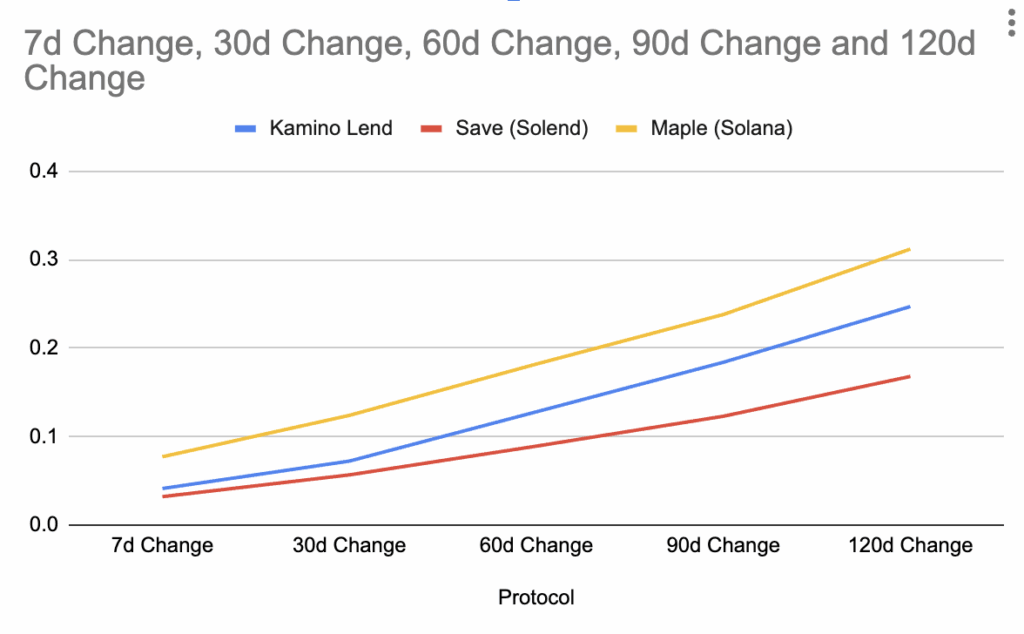
| Protocol | TVL | Category | 7d Change | 30d Change | 60d Change | 90d Change | 120d Change | Utilization Rate |
| Kamino Lend | $2.16B | Algorithmic Lending | +4.13% | +7.23% | +12.8% | +18.4% | +24.7% | 78% |
| Save (Solend) | $216M | Risk-Adjusted Lending | +3.21% | +5.67% | +8.92% | +12.3% | +16.8% | 68% |
| Maple (Solana) | $1.74B | Credit Marketplace | +7.72% | +12.4% | +18.2% | +23.8% | +31.2% | 85% |
High utilization rates demonstrate healthy credit demand across protocol segments
Kamino Lend’s 90.8% market share within native Solana lending represents significant concentration, though the $2.16B scale and 78% utilization rate indicate healthy credit demand. Maple Finance’s $1.74B represents substantial professional credit market development.
The coexistence of algorithmic retail lending, credit marketplaces, and CDP models indicates mature market segmentation based on user requirements.
Section 4: Derivatives Protocol Assessment
4.1 Advanced Trading Infrastructure Evaluation
Evaluated: $720M daily derivatives volume (8.1% of global perpetual trading)
| Protocol | TVL | Daily Volume | 7d Change | 30d Change | Volume/TVL | Trading Model |
| Jupiter Perpetual Exchange | $1.60B | $319M | -22.7% | -3.89% | 19.5% | LP-to-trader |
| Drift Trade | $696M | $203M | +41.6% | +396.5% | 29.2% | Cross-margined |
| GMX V2 (Solana) | Variable | $6.1M | +14.1% | +120.6% | Variable | Multi-chain |
Innovative trading models eliminate traditional market maker dependencies
Jupiter’s LP-to-trader model eliminates traditional market maker requirements, utilizing liquidity provider pools as counterparties. Drift’s cross-margined system enables portfolio-level risk management, reducing capital requirements for sophisticated traders.
Combined $720M daily derivatives volume establishes Solana as significant derivatives ecosystem beyond experimental usage.
Section 5: Cross-Chain Infrastructure Assessment
5.1 Bridge and Connectivity Analysis
| Protocol | TVL | Specialization | Chain Coverage | 7d Change | 30d Change |
| Portal (Wormhole) | $2.52B | Multi-chain Bridge | 24+ chains | +4.93% | +12.4% |
| Eclipse Bridge | $56M | Solana SVM L2 | Ethereum ↔ Eclipse | +10.6% | +23.8% |
| Zeus Network | $31M | Bitcoin Integration | Bitcoin ↔ Solana | +8.2% | +18.7% |
Substantial bridge TVL indicates destination role rather than isolated development
Portal’s $2.52B TVL represents 28.9% of total ecosystem TVL, indicating substantial cross-chain capital flows rather than isolated development.
Eclipse Bridge represents innovation in scaling solutions maintaining Solana’s architectural advantages while providing Ethereum compatibility.
Section 6: Volume Analysis and Market Assessment
6.1 Trading Activity Assessment
| Category | Daily Volume | 7d Volume | 30d Volume | Global Market Share | Performance Trajectory |
| Spot Trading | $756M | $5.29B | $22.7B | 2.1% global | +8.23% (30d) |
| Derivatives | $720M | $5.04B | $21.6B | 8.1% global | +396.5% (30d) |
| Combined | $1.48B | $10.3B | $44.3B | 3.2% global | +35% (30d) |
Derivatives outperformance (vs most other L1s) suggests competitive advantages in complex applications
The ecosystem-wide 17.0% volume/TVL efficiency indicates active capital deployment comparing favorably to most L1 platforms operating at 3-8% efficiency levels. Derivatives volume approaching spot volume indicates sophisticated trading infrastructure supporting professional activity levels.
Solana’s 8.1% global derivatives share substantially exceeds 2.1% spot share, indicating competitive advantages in complex trading applications.
Section 7: Risk Assessment Framework
7.1 Concentration and Market Structure Analysis
Concentration risks mitigated by category diversification and competitive alternatives
Liquid staking’s 62.5% TVL allocation differs from Ethereum’s 35% allocation, indicating network security prioritization.
Jito’s 30.7% ecosystem TVL concentration creates systematic risks partially mitigated by competitive alternatives and category diversification.
Top 5 protocol concentration at 75% TVL includes diverse categories, reducing single-point-of-failure risks.
Healthy tier distribution provides innovation pipeline from experimental to established
Solana’s protocol development shows healthy tier distribution (as per Caladan’s conception of “healthy tier distribution”):
- established infrastructure >$500M TVL
- specialized implementations $50M-500M TVL
- emerging protocols $5M-50M TVL
- and experimental applications <$5M TVL providing innovation pipeline.
Evaluation Framework Conclusions
This protocol evaluation framework demonstrates Solana’s comprehensive DeFi infrastructure across 139 protocols managing $8.72B TVL. Technical architecture advantages through sub-second finality and parallel processing enable protocol innovations and capital efficiency metrics differentiating the ecosystem from alternatives requiring additional scaling layers.
Solana’s extant 17.0% volume/TVL efficiency substantially outperforms most L1s (which are typically at 3-8% efficiency as of the time of writing) while maintaining sophisticated protocol diversity. Multi-timeframe analysis reveals measured capital allocation patterns supporting network security prioritization alongside derivatives markets generating globally significant trading activity.
Protocol development across comprehensive DeFi categories with healthy competitive dynamics provides multiple approaches within each category enabling risk distribution while maintaining innovation incentives.
The framework serves as foundational research for understanding Solana’s DeFi ecosystem structure and capabilities through quantitative assessment.
