Table of Contents
The State of Liquidity Report, published quarterly, offers valuable insights on the past quarter’s market listings and liquidity landscape. It covers overall market trading trends, volumes and volatility, token listing and delisting activity, and insights on notable listings during this period. This report may be useful for projects that are looking to launch their own token in the near future, projects that are already listed, as well as investors and other market participants.
All the data used in this report is collected from publicly available sources.
Executive Summary
Despite significant market events such as the Bitcoin halving, Bitcoin ETF approval and listing, imminent Ethereum ETF approval and an unexpected fresh filing for a Solana ETF - in the near term, the market appears to...
Deeper Insights Ahead
Table of Contents
The State of Liquidity Report, published quarterly, offers valuable insights on the past quarter’s market listings and liquidity landscape. It covers overall market trading trends, volumes and volatility, token listing and delisting activity, and insights on notable listings during this period. This report may be useful for projects that are looking to launch their own token in the near future, projects that are already listed, as well as investors and other market participants.
All the data used in this report is collected from publicly available sources.
Executive Summary
Despite significant market events such as the Bitcoin halving, Bitcoin ETF approval and listing, imminent Ethereum ETF approval and an unexpected fresh filing for a Solana ETF – in the near term, the market appears to have shedded the strong momentum from earlier this year. Inflows into BTC ETFs have slowed and general crypto prices have declined even while equities continue pushing all time highs. This is in part due to various factors such as:
- the overhang of Mt. Gox Bitcoin supply (over 142,000 BTC and 143,000 BCH) finally hitting the market after 10 years
- the German government selling over 50,000 BTC – with over $400m USD worth of Bitcoin sold so far
- increased push from SEC – various last ditch efforts to cripple the sector, such as
- Uniswap issued Wells notice for violating US securities laws
- Lido and Rocket Pool’s tokens labelled as securities
- Probe into Ethereum which abruptly ended just as it started
- Charging Consensys over MetaMask’s brokerage and staking service, engaging in “unregistered sale of securities” and “operating as an unregistered broker”
All stacking up significant negative pressure and uncertainty, resulting in temporary caution from buyers.
On the other hand, the expected Ethereum ETF approval by this summer should in theory provide some relief. We’re also seeing demand and interest from institutions – a narrative that has been long in the making, finally coming into fruition. Financial advisors are recommending diversification into crypto ETFs for retail investors seeking greater returns (and volatility), adding some fresh liquidity into the system.
In other news, recent backlash about the potential of VCs and CEXes colluding around high FDV, low float coins – a basket of which have significantly declined starting mid-quarter – has affected general market volumes in mid-April, before making a comeback around late May. Listing numbers across CEXes have remained strong this quarter, too. We expect to see changes in listing strategy around the low float/high FDV issue going forward and some relief bounce for crypto closer to the news of the actual Ethereum ETF approval.
1. Overall crypto market
a. Centralised / Decentralised Trading Activity
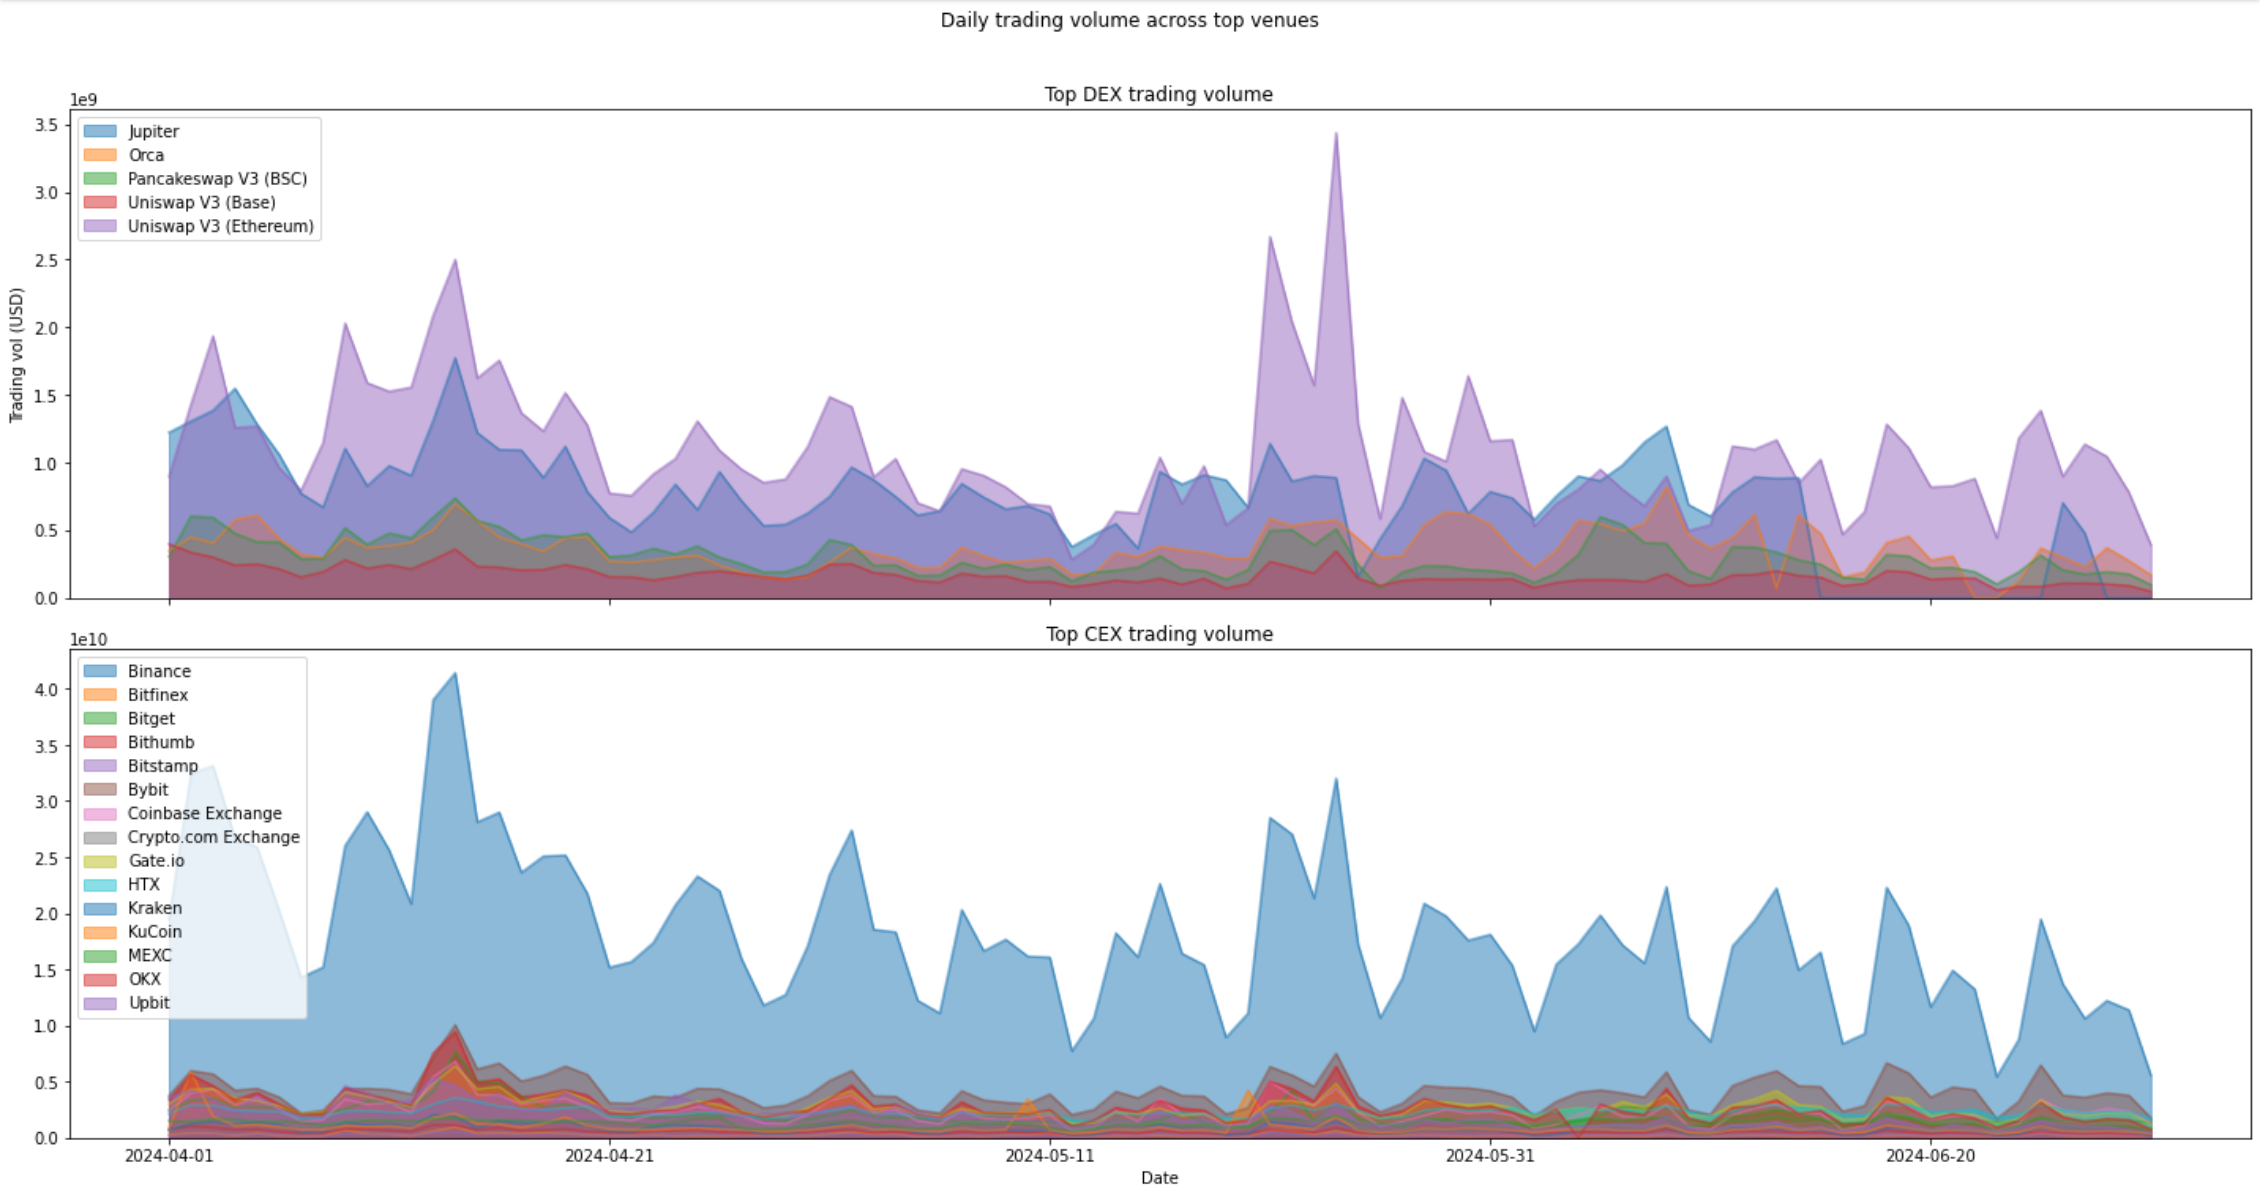
Figure 1: Top 15 CEXs and Top 5 DEXs from CoinMarketCap Ranking.
| Q2 2024 | Q1 2024 | Q4 2023 | Q3 2023 | Q2 2023 | Q1 2023 | |
|---|---|---|---|---|---|---|
| CEX trading volume | $3.8t | $4.7t | $2.2t | $1.2t | $1.4t | $2.5t |
| DEX trading volume | $240b | $234b | $111b | $57b | $93b | $137b |
Figure 2: This aggregated trading volume from Top 15 CEXs and Top 5 DEXs from CoinMarketCap, not total volume overall, and is meant to be context for Figure 1.
- While DEX volume has increased from Q1 2024, CEX volume has gone down – the first time we have seen this trend in the last year. This has shown the resilience and increasing popularity of the DEX’s with trends such as pump dot fun and Solana memecoin season. Most notably, there are very good metrics for sol onchain – daily transactions have been on a significant rise while volumes have been competitive against Ethereum and its L2s combined.
- One of the main commentaries of this quarter is “VC coins”, that most of the coins listed on Binance have high fully diluted valuations, but little circulating supply on day 1. A number of the tokens that listed on CEX’s all fell together in April. There are a number of theories about this, but the simplest answer might be the most true — there is too little supply for price discovery. The average circulation is only about 13%, as compared to 42% in 2022. These coins are doing significantly less well in terms of price.
b. Token Listing and Delisting Activity
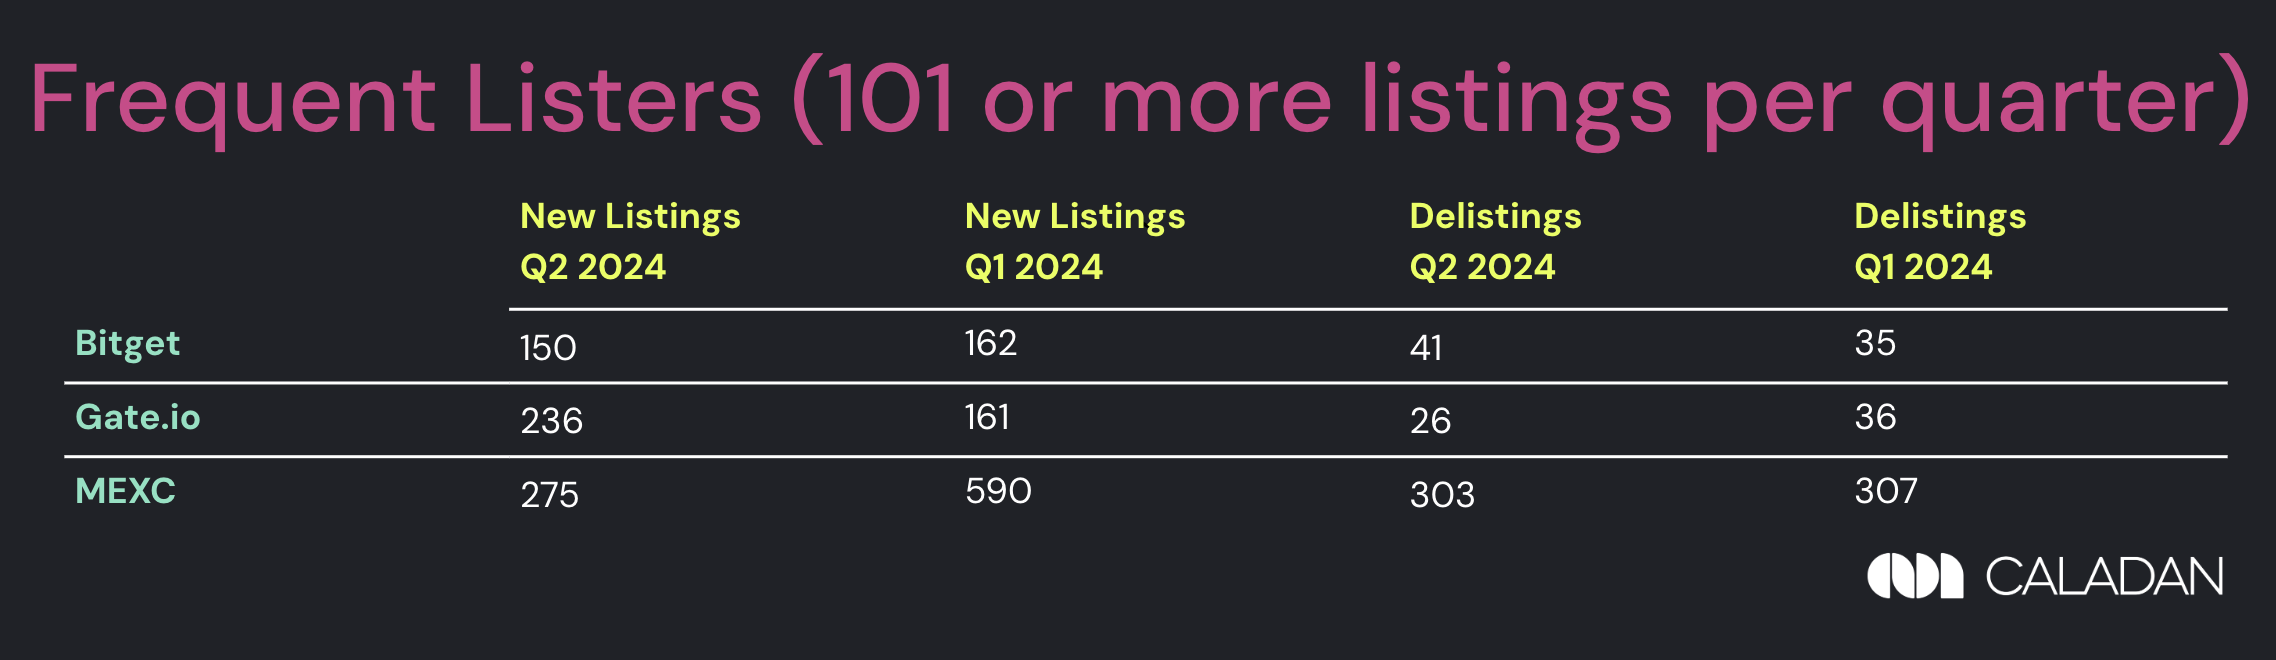
Figure 3: Frequent Listers (101 or more listings per quarter)*
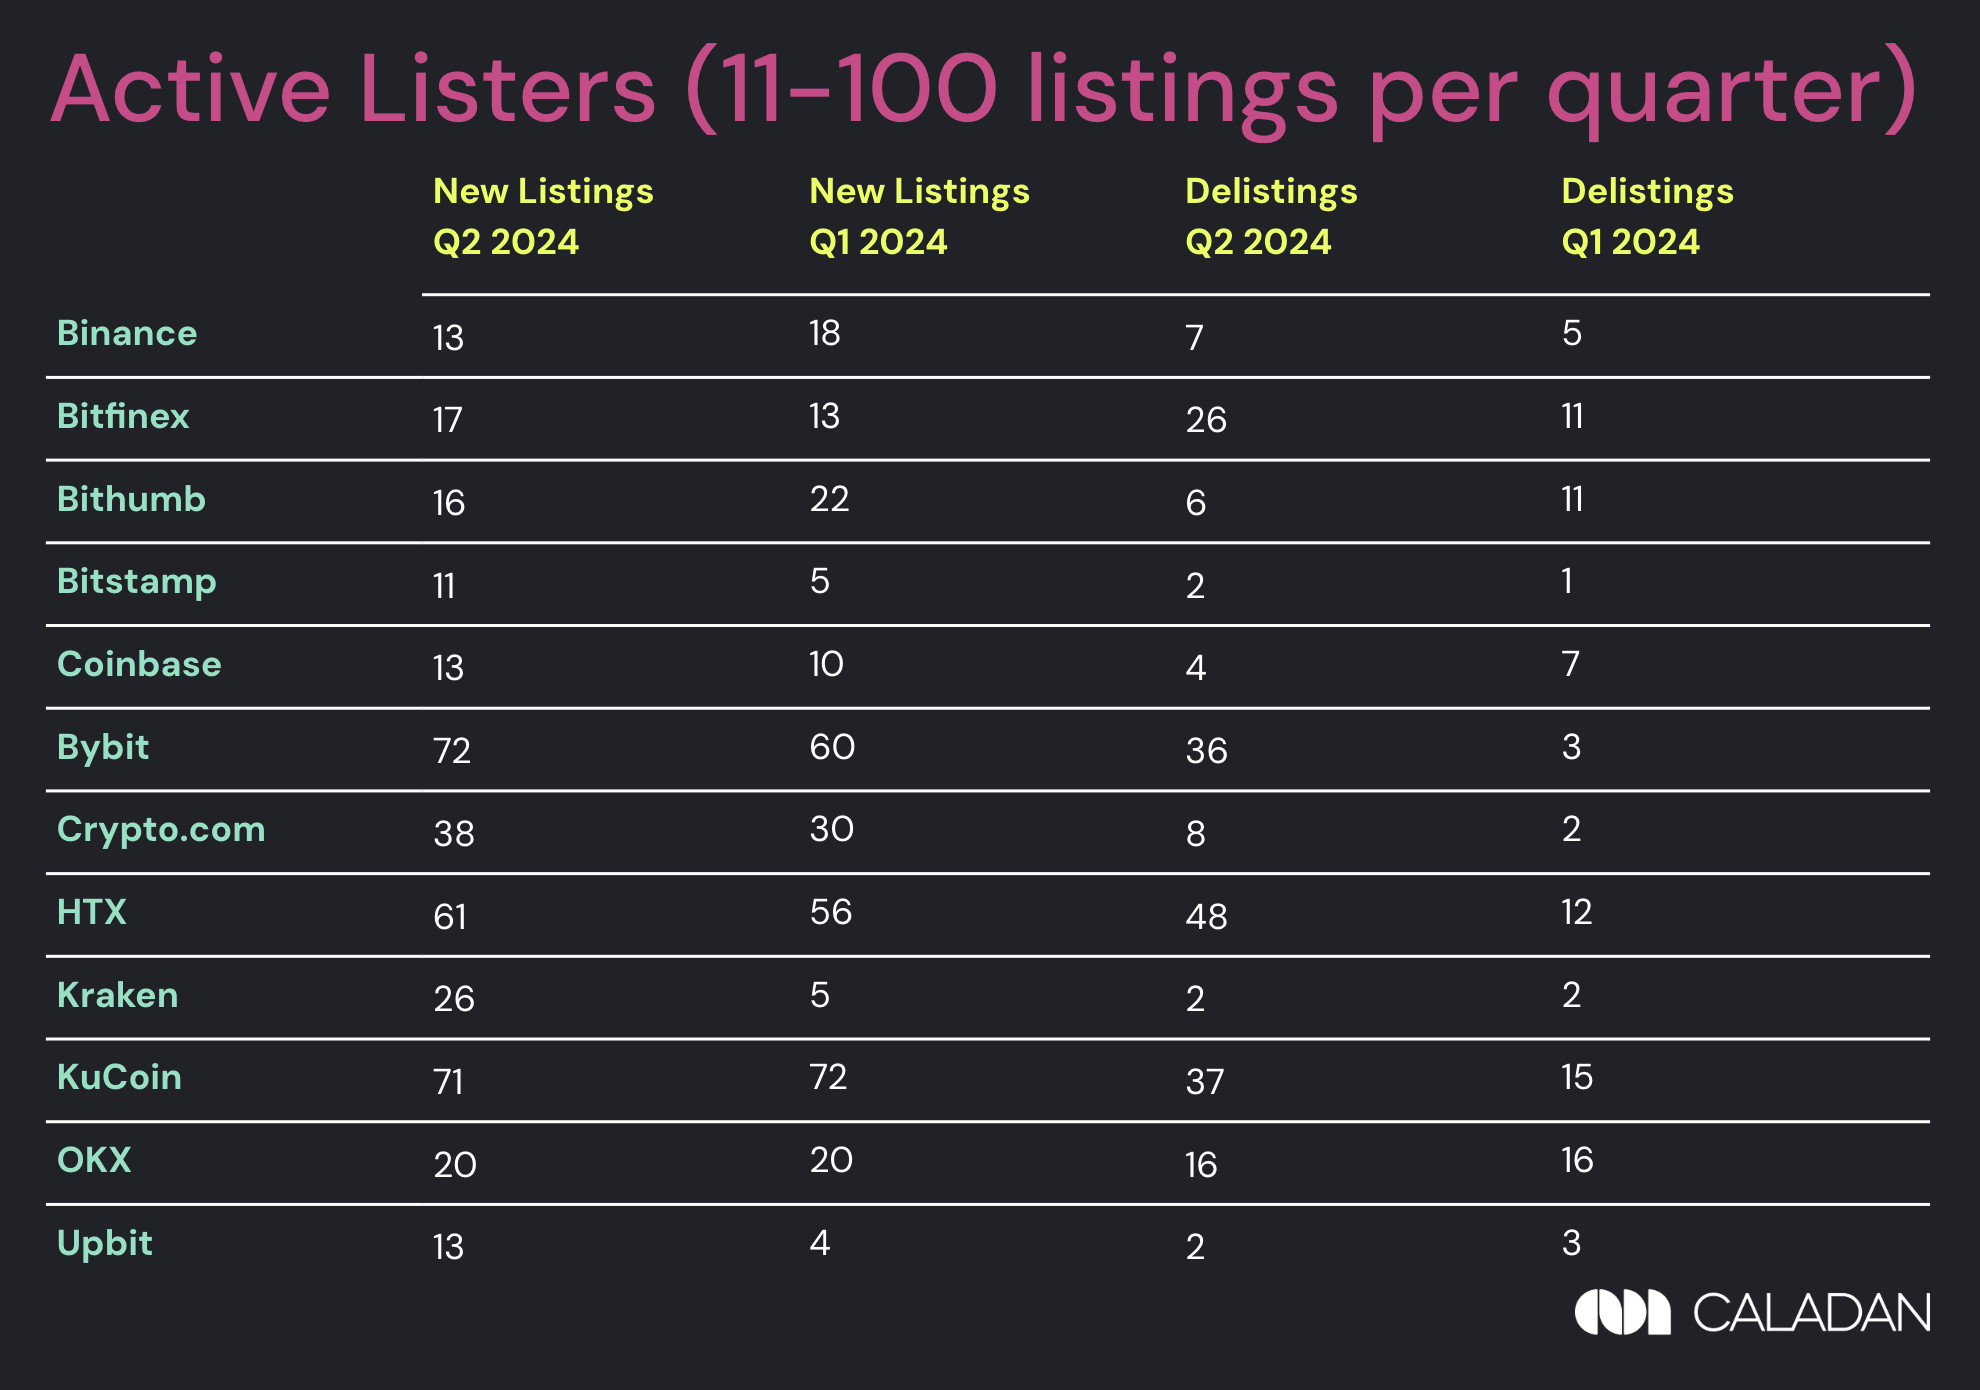
Figure 4: Active Listers (11-100 listings per quarter)*
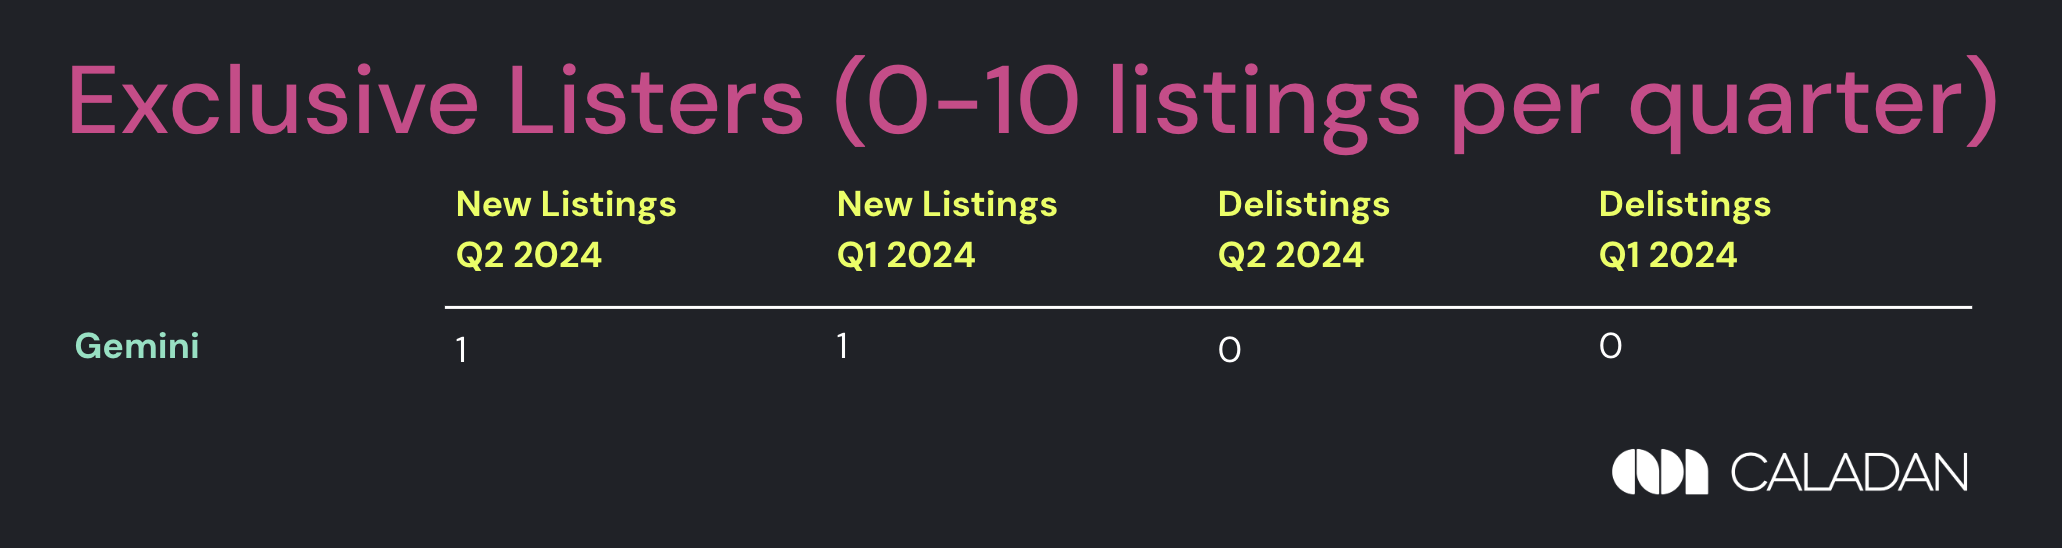
Figure 5: Exclusive Listers (0-10 listings per quarter)*
*CoinMarketCap Top 15 by trust score (excluding Binance Turkey). Data on previous listings are pulled from various data feeds and cross checked against exchange announcement pages, their spot trading platforms, and X. Leveraged tokens, rebrands and migrations are excluded.
- At first glance: All other exchanges have graduated from the Exclusive Listers tier this quarter — with the exception of Gemini being very shy with just 1 listing and 0 delistings this quarter, similar to the last quarter.
- in Active Listers, listings have mostly remained consistent or increased across the board besides Binance, Bithumb and KuCoin.
- Interesting to note – MEXC has slowed their pace of listings by under half, while Gate has significantly picked up the pace to get closer to MEXC listing numbers, showing their hunger to compete.
- Delistings remained generally consistent – outliers are Bybit, Bitfinex, HTX and KuCoin where delisting numbers have grown quarterly.
- Gate has done very well in terms of listing numbers — in our liquidity data for Q2, Gate has also piqued our curiosity with significantly improved depths on their pairs.
c. State of Liquidity on Top 1000 Tokens (ranked by ADV)
To provide an overview of the overall state of market liquidity, we survey the top 1000 tokens as listed on CoinMarketCap and detail liquidity metrics across their respective top 3 exchange venues.
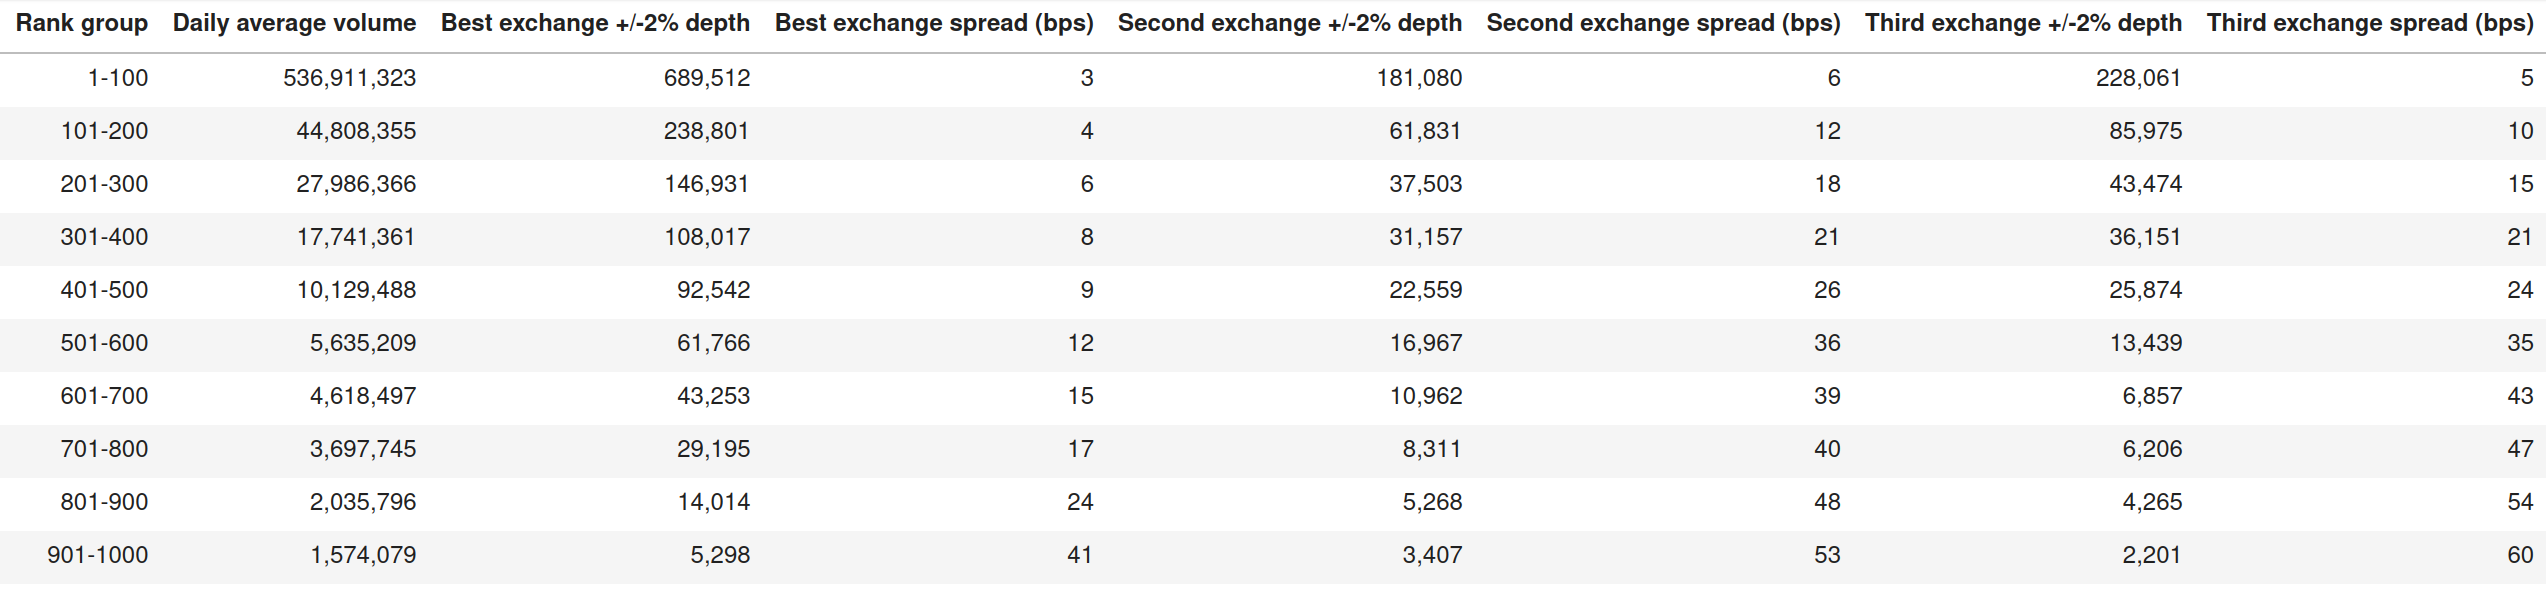
Figure 6: Top 1000 tokens ranked by volume of top performing exchange
Compared to our data in Q1, Daily Average Volume for the top 100 group increased a third from last quarter, whereas 101-400 group actually fell, meaning consolidation around the the top coins. Additionally, slightly increased depths and lowered spreads can be observed.
- Similar to Q1, liquidity is heavily concentrated in the top 100 tokens in terms of (1) daily trading volumes, (2) market depth and (3) spread across the top 3 exchanges for the tokens.
- There is an increasing concentration from in the top 100 as compared to last quarter. This also shows in the best exchange depth of the 101-200 coins as well, which has decreased. However, the depths of coins lower than that have actually increased.
2. Insights on Q2 notable listings
Notable listings in Q2 2024
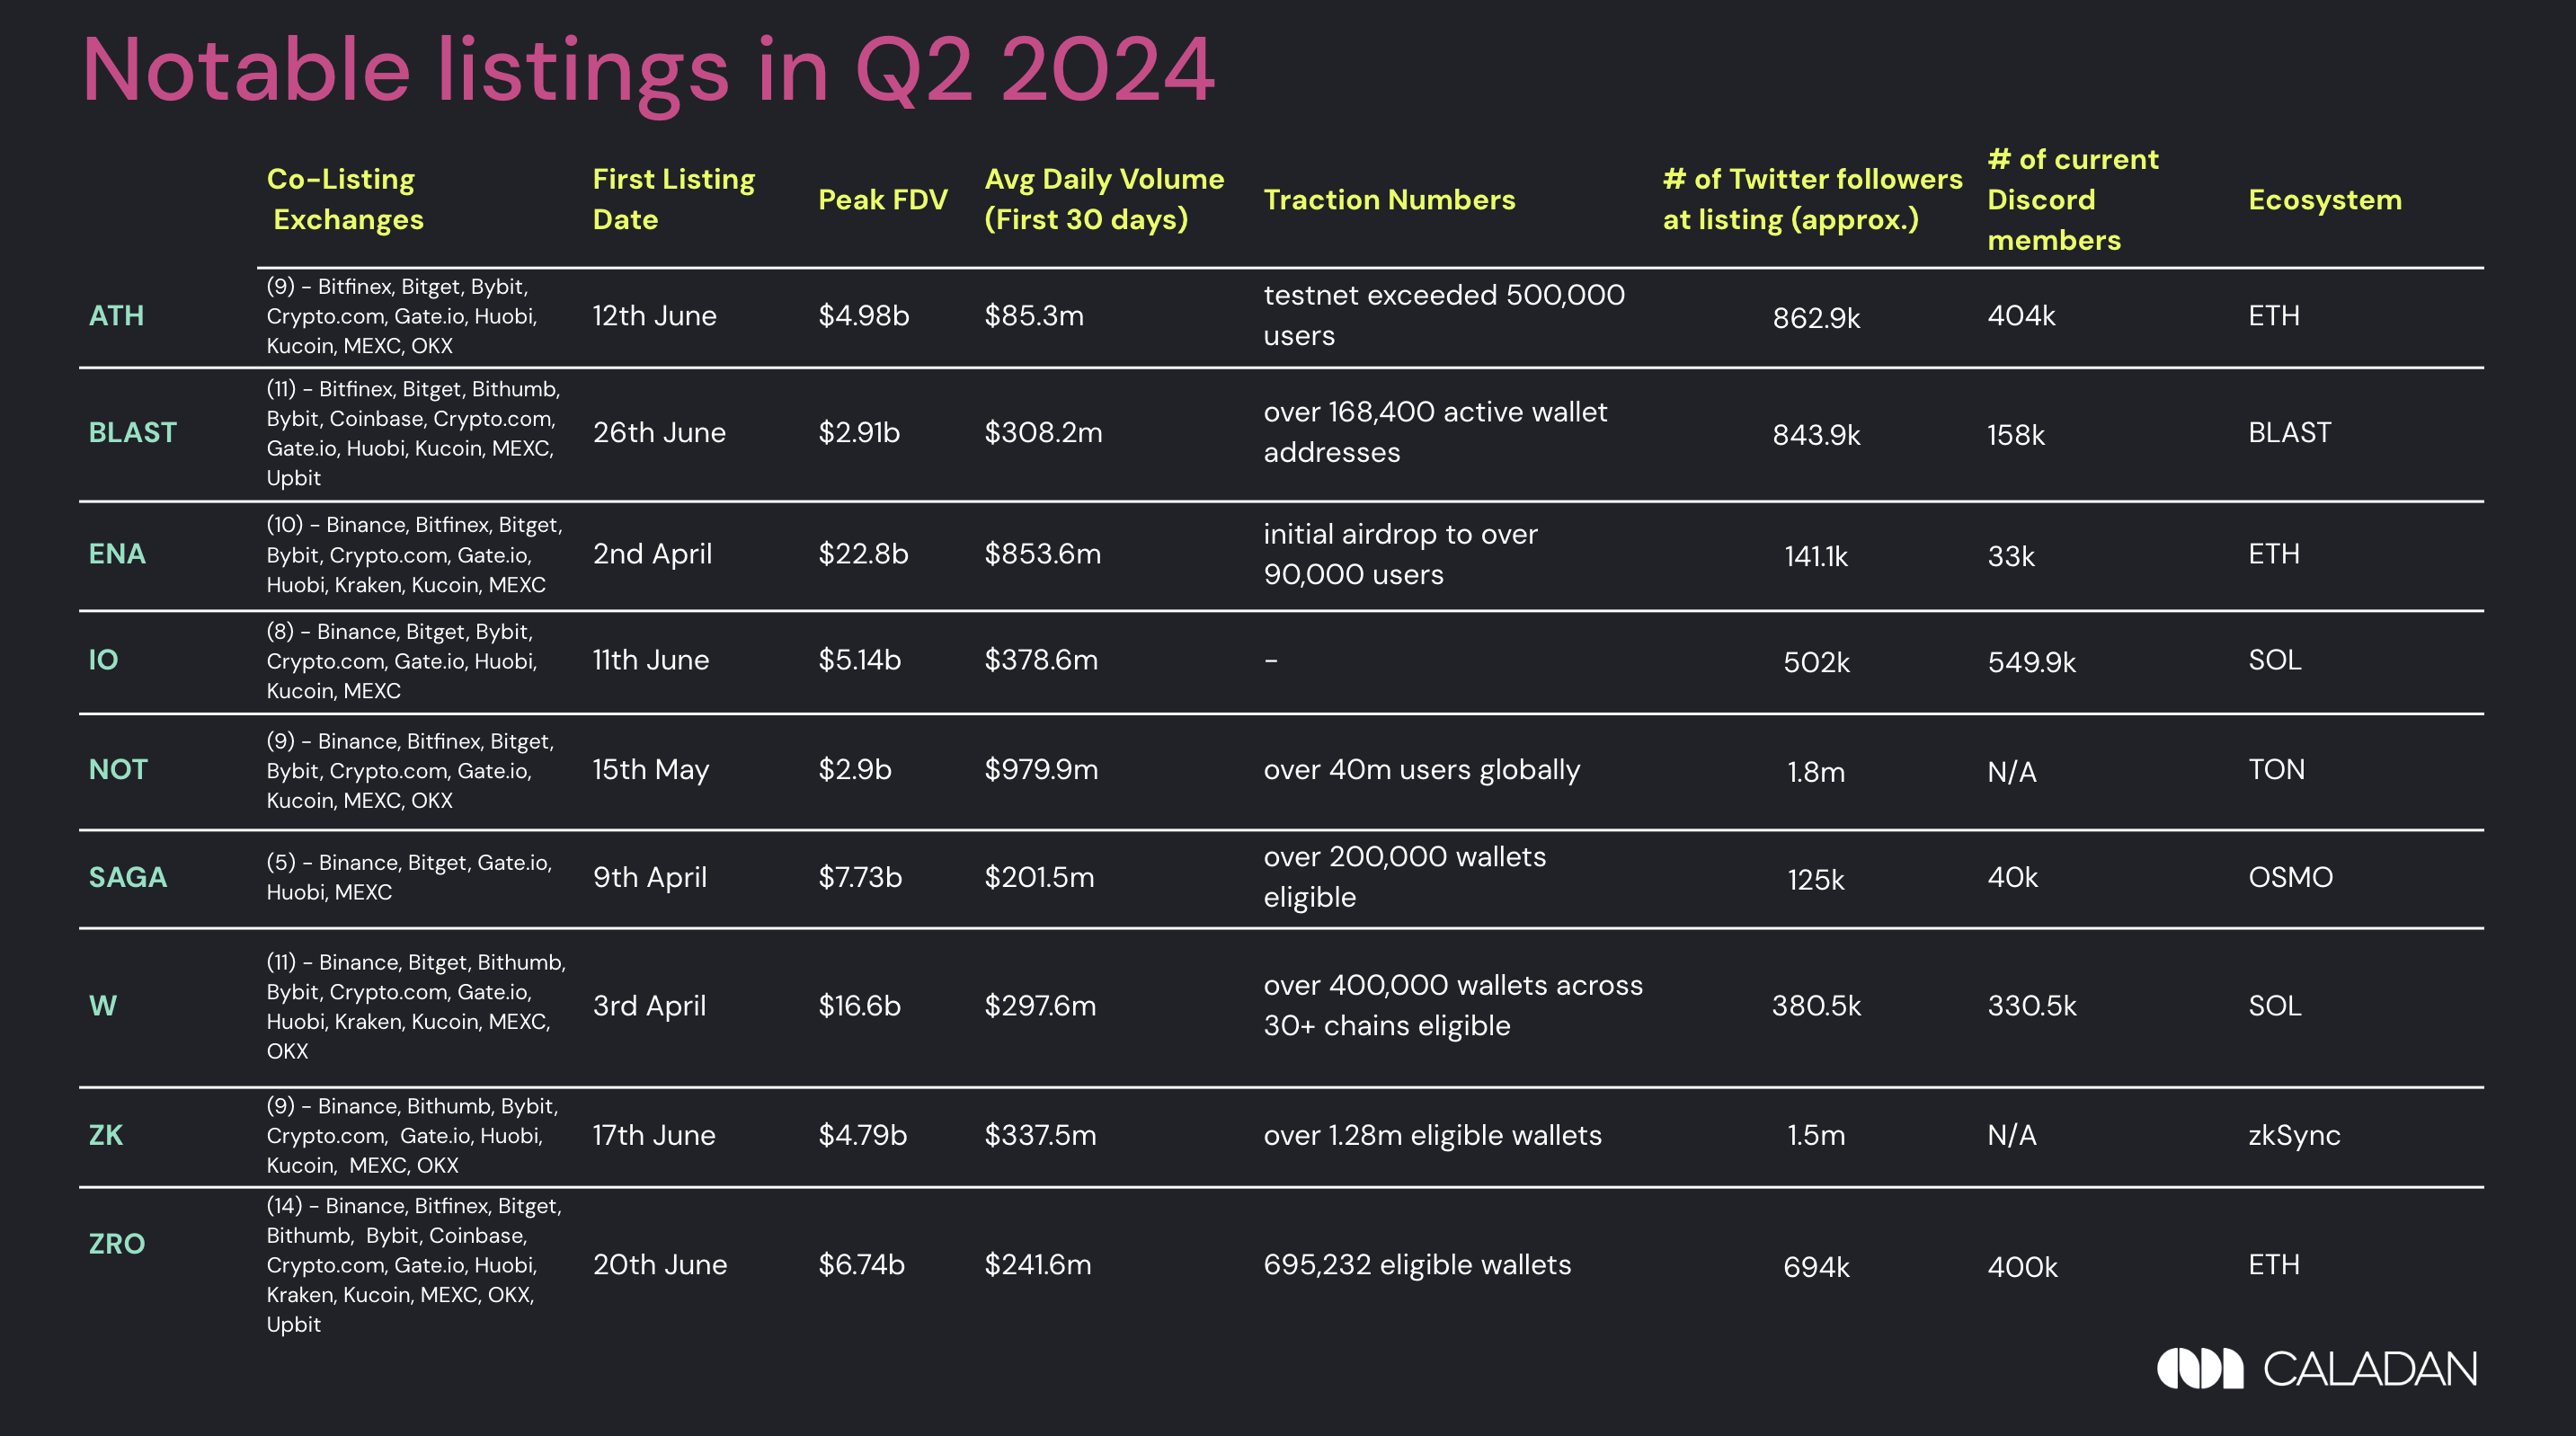
Figure 7: Comparison stats for Notable Listings in Q2 2024
In Q2 2024, the criteria for notable listings remained tight, focusing on coins that launched and sustained over $300M Market Cap for over 24 hours post-listing. Despite the significant uptick in Q1 2024 listing activity, Q2 2024 saw more pronounced activity driven by heightened retail interest, particularly in airdrop farming.
- Number of co-listing Exchanges: With exception of SAGA, most Notable Listings debuted on 9 or more exchanges – with ZRO being the most generous on 14 exchanges. At first glance, FDV and market cap appear to be uncorrelated to number of co-listings and trading volumes.
- High FDV/Low Float discourse: The high FDV/low float listing discourse was fuelled by the release of ENA, Wormhole illustrating the huge disparity in actual FDV across listings this quarter, as others mostly peaked at single digit billion FDVs.
- Ecosystem Diversity: Q2 saw listings across a variety of ecosystems beyond ETH – notably, NOT has outperformed most other Notable Listings and managed to gain significant traction in terms of user metrics. As a retail-facing game on Telegram, they’ve worked well to onboard non-crypto users and are the most successful recent case of web2 to web3 adoption.
a. Volume performance
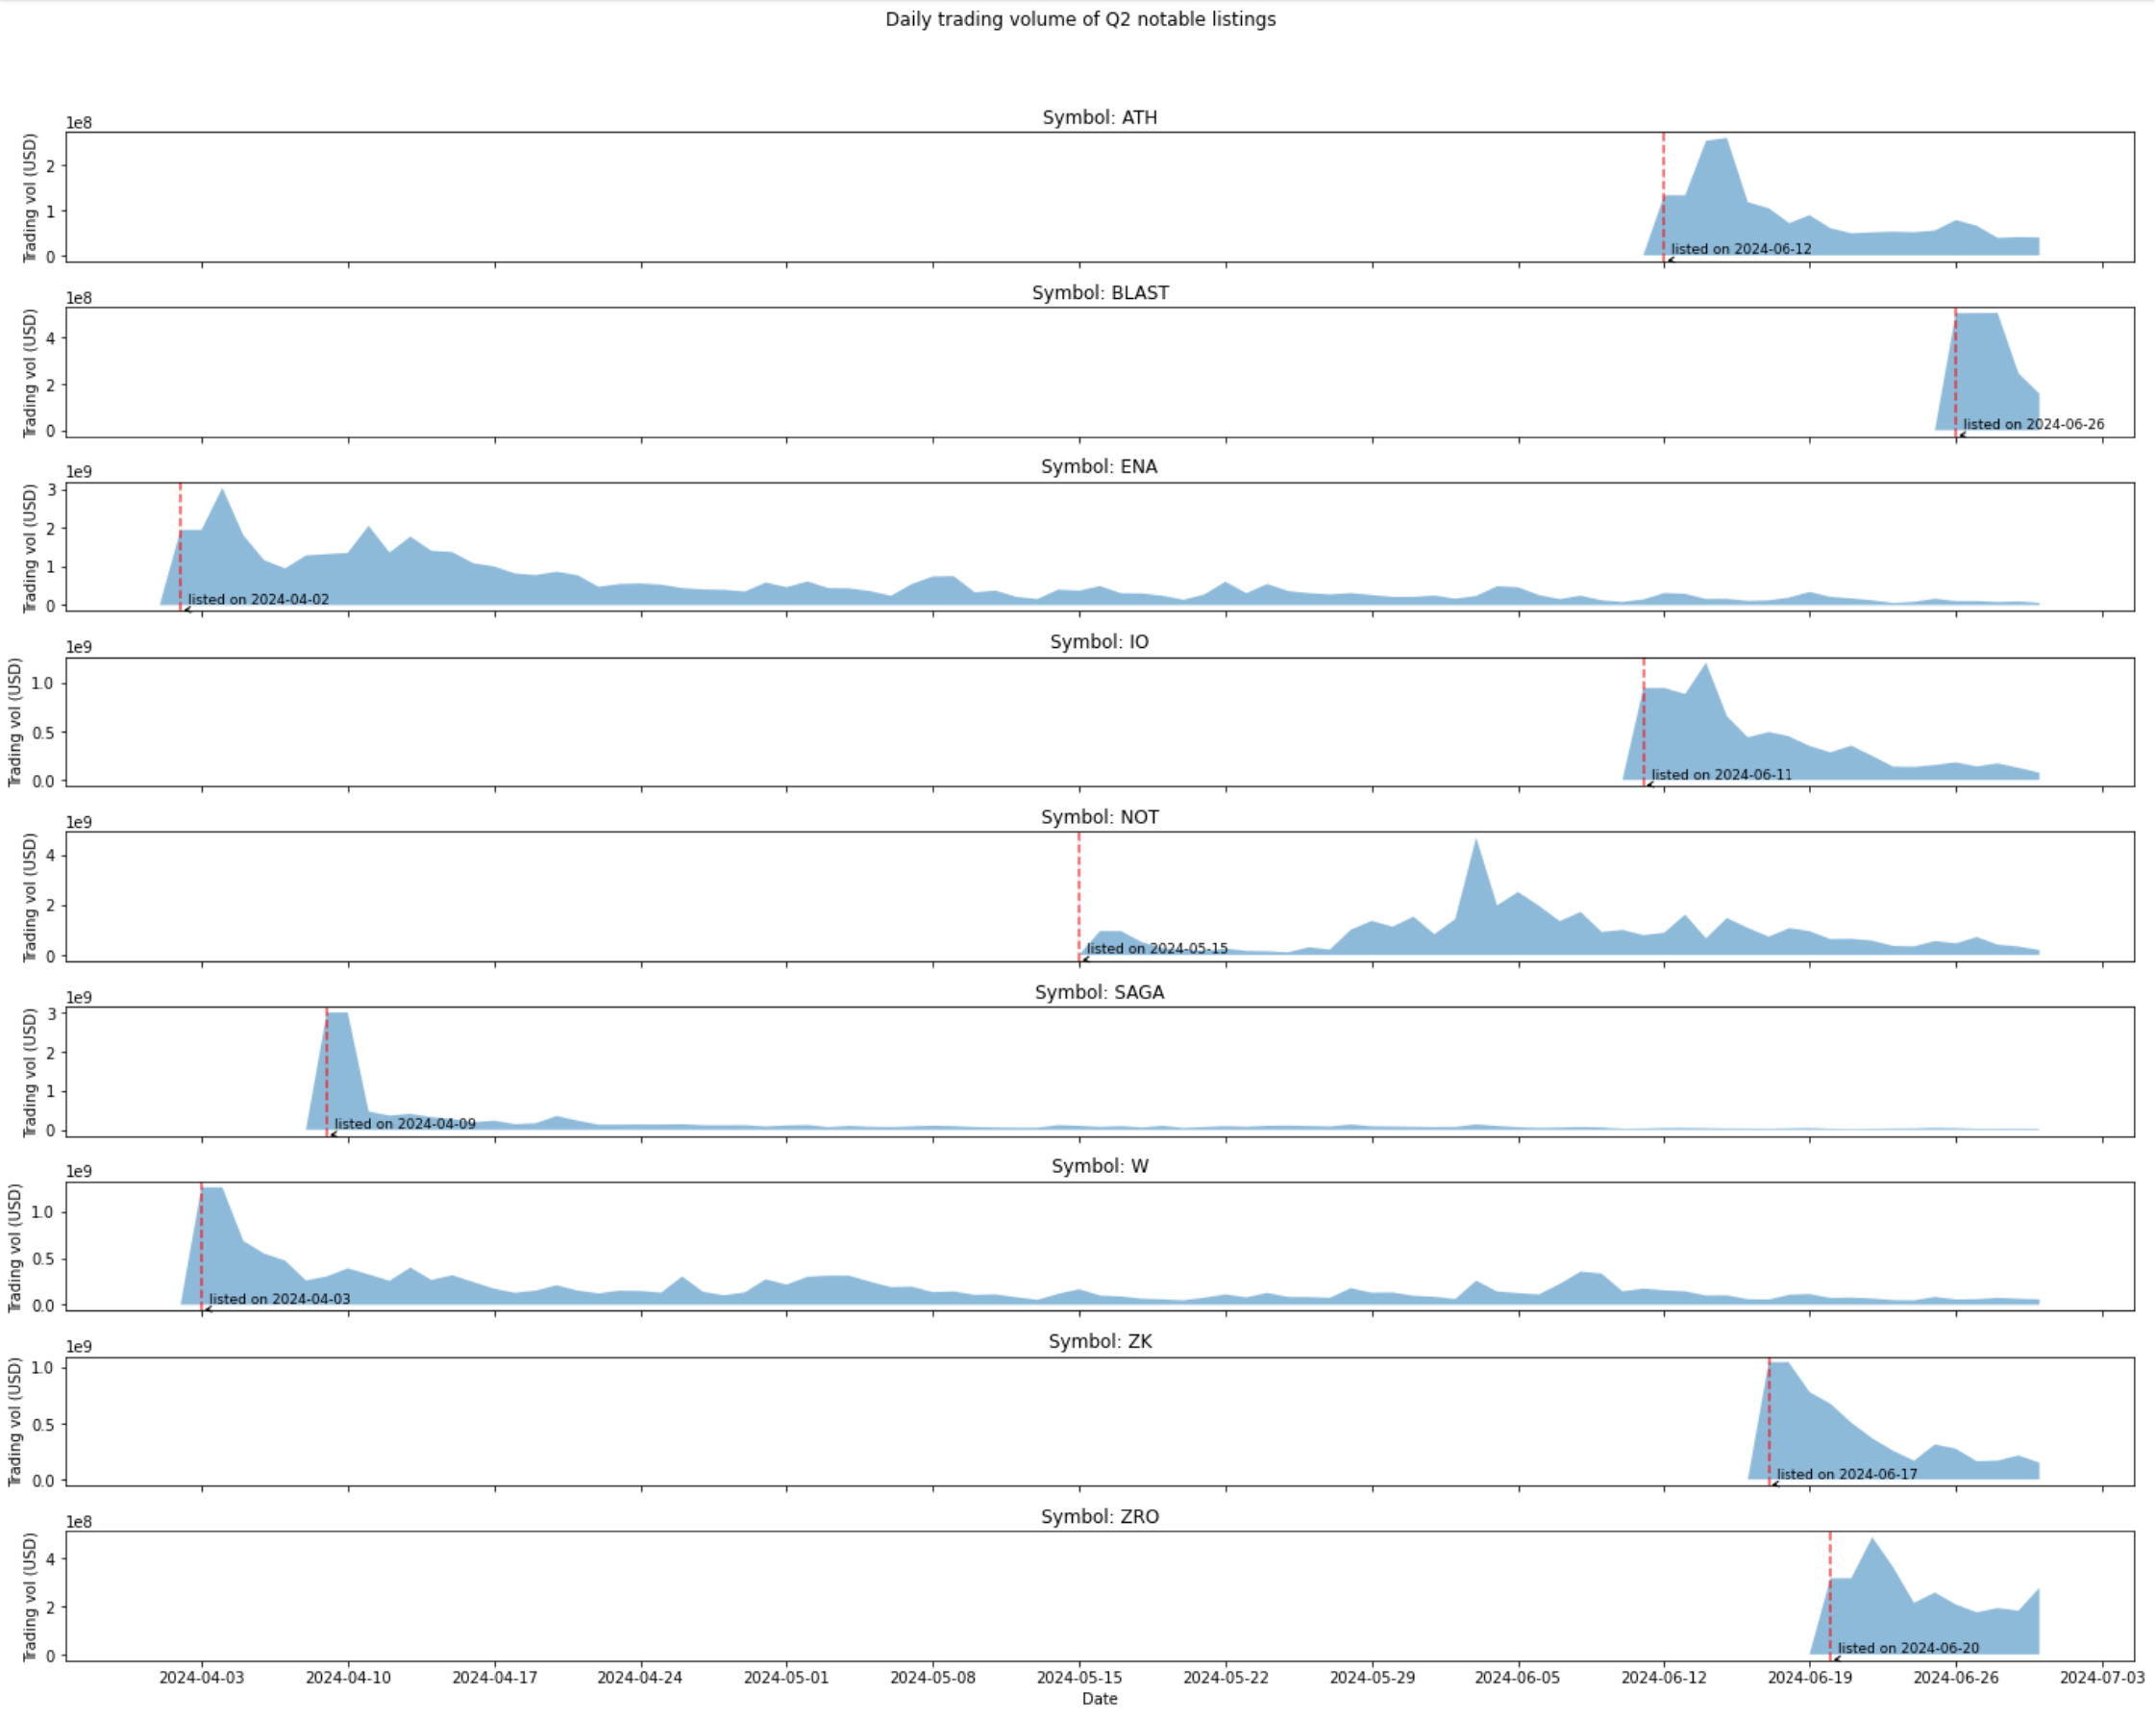
Figure 8: Daily Trading Volume of Q2 Notable Listings
- While most coins’ trading volumes peaked within the first week of listing, only NOT had a delayed peak.
- Typically, trading volumes tend to peak at listings and experience a subsequent dip.
- This quarter saw very strong sell pressures at listing as bearish general momentum caused liquidity in the system to dry up as buyers went risk-off.
b. Liquidity performance
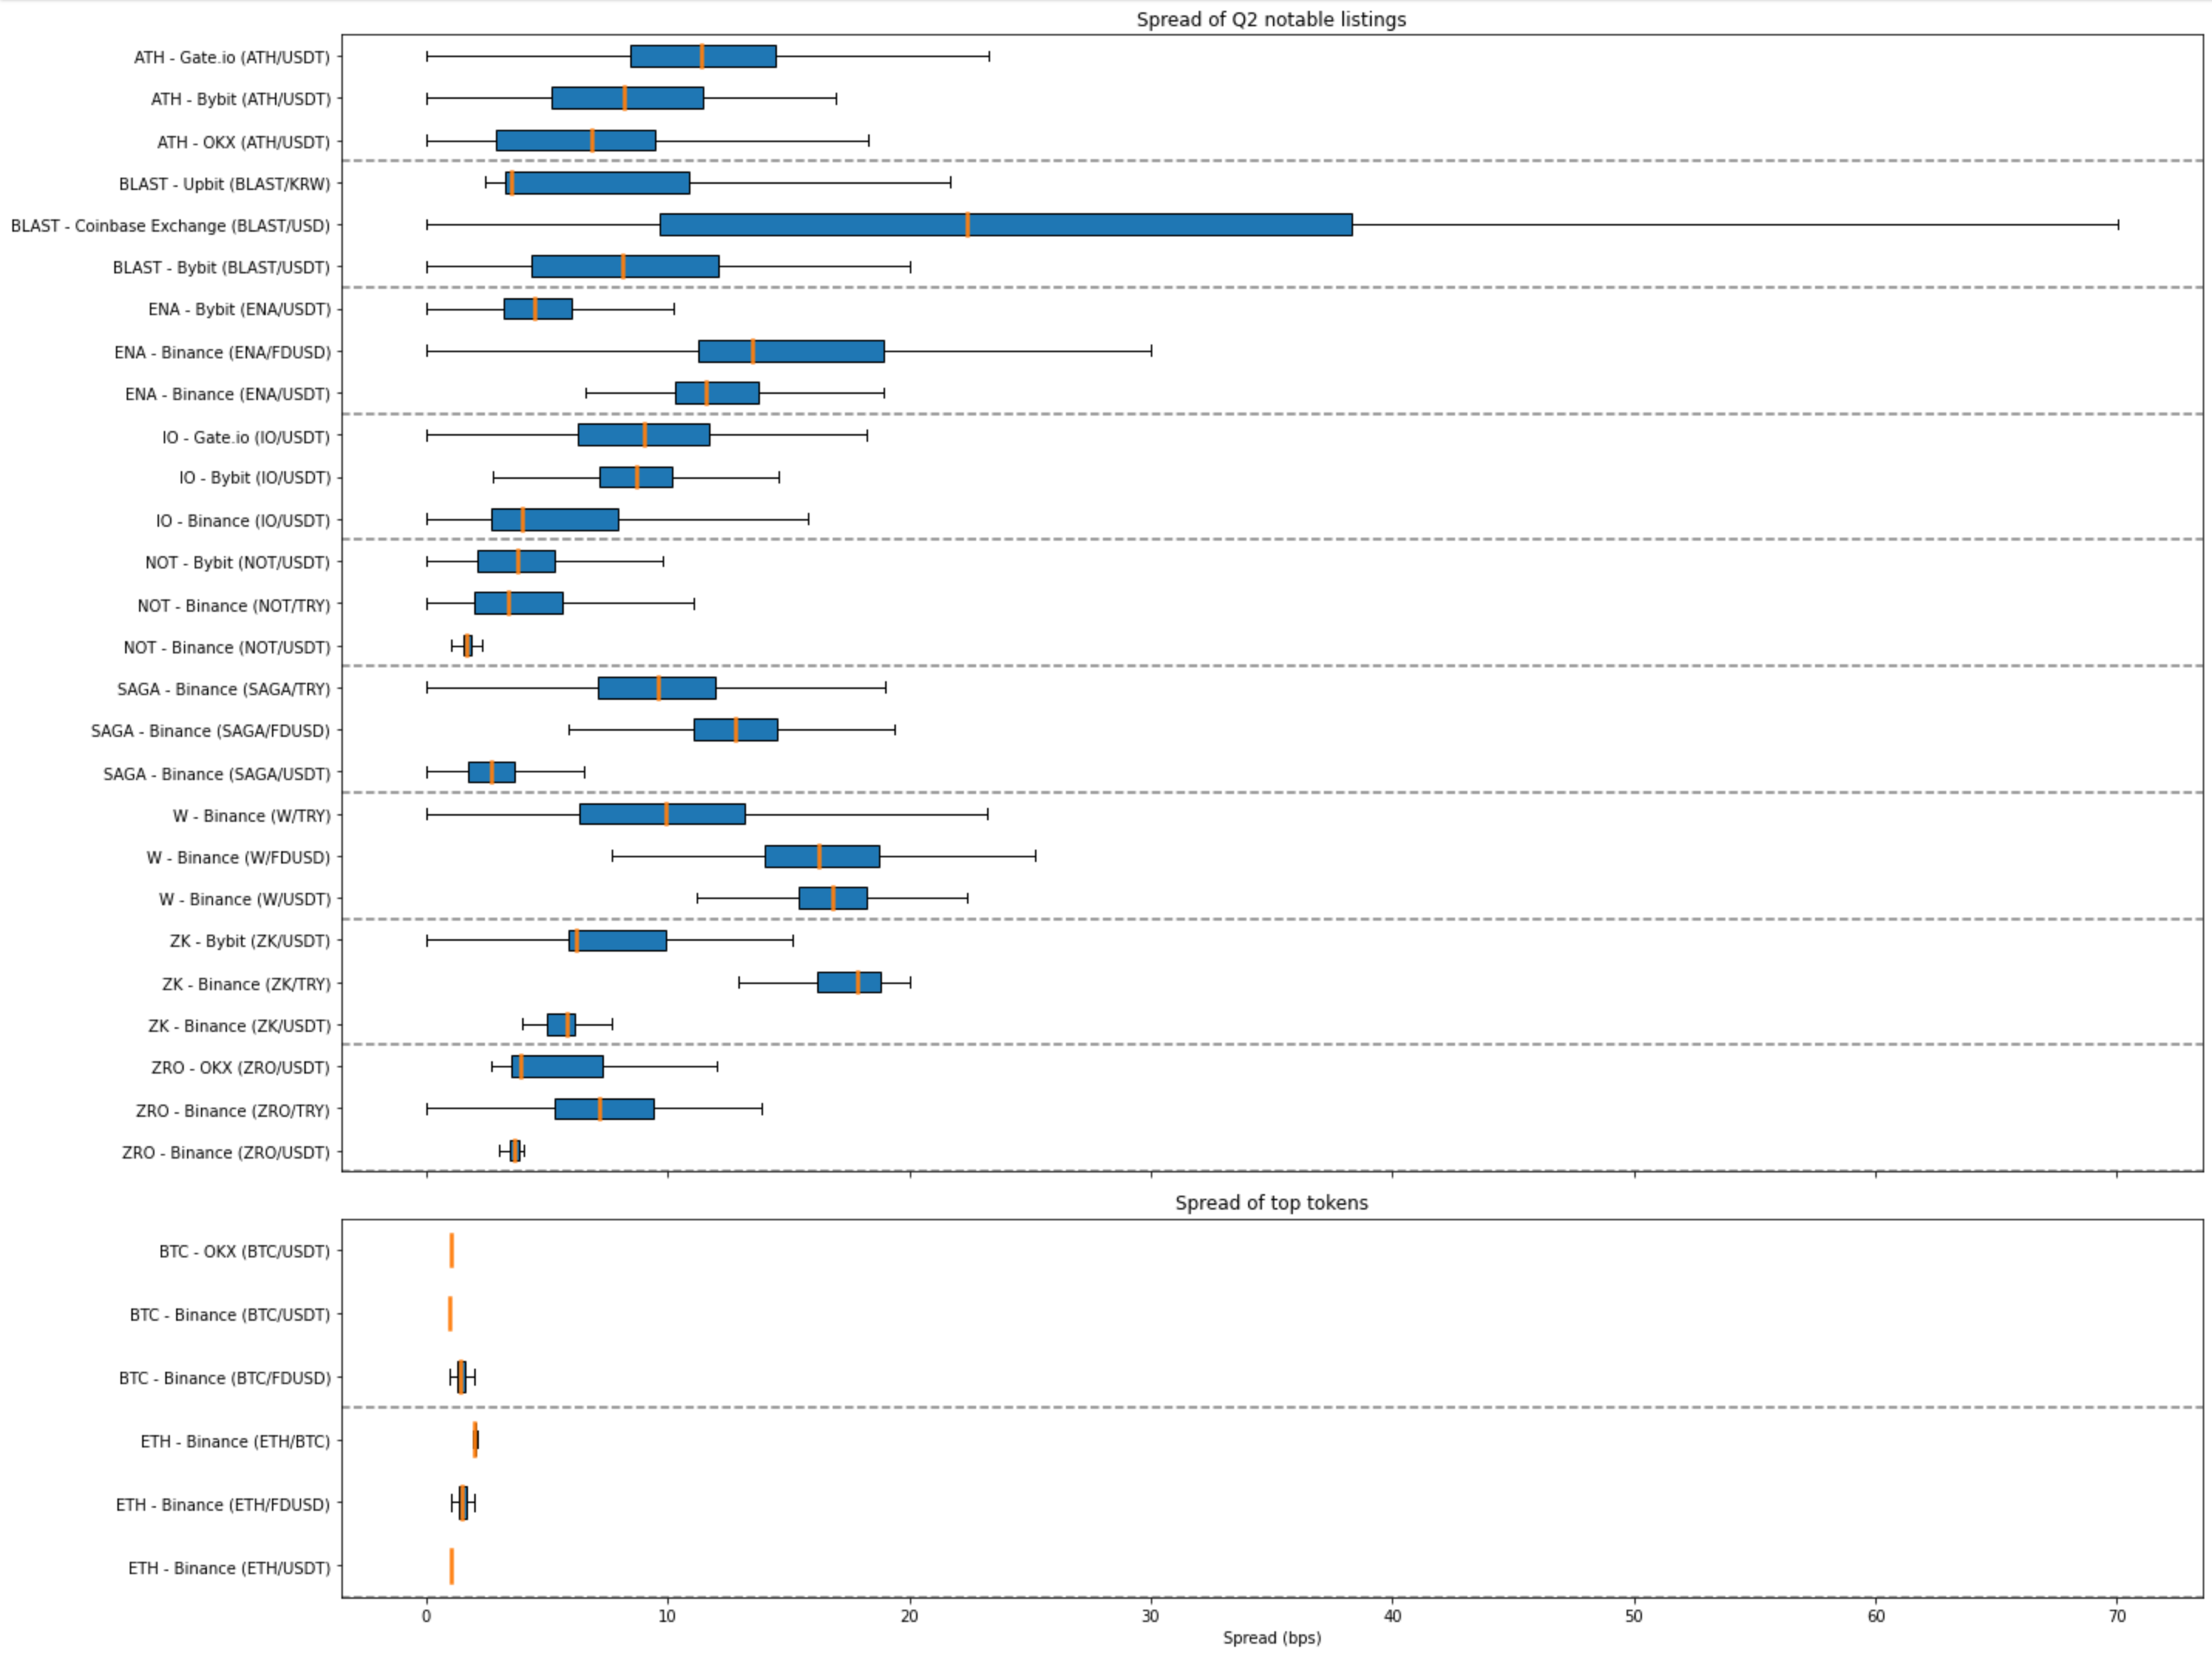
Figure 9: Spread of Q2 Notable Listings in Comparison to BTC and ETH
- Best performers were NOTUSDT and ZROUSDT on Binance
- Despite Binance’s reputation as a market leader, OKX edged them out in BTC/USDT spread
- Gate has also come out on top for several Notable Listing pairs
- Blast on Coinbase was worst performing token in terms of spread
- Competition is extremely strong — it appears that Binance is gradually ceding top spot in several pairs to hungry competitors
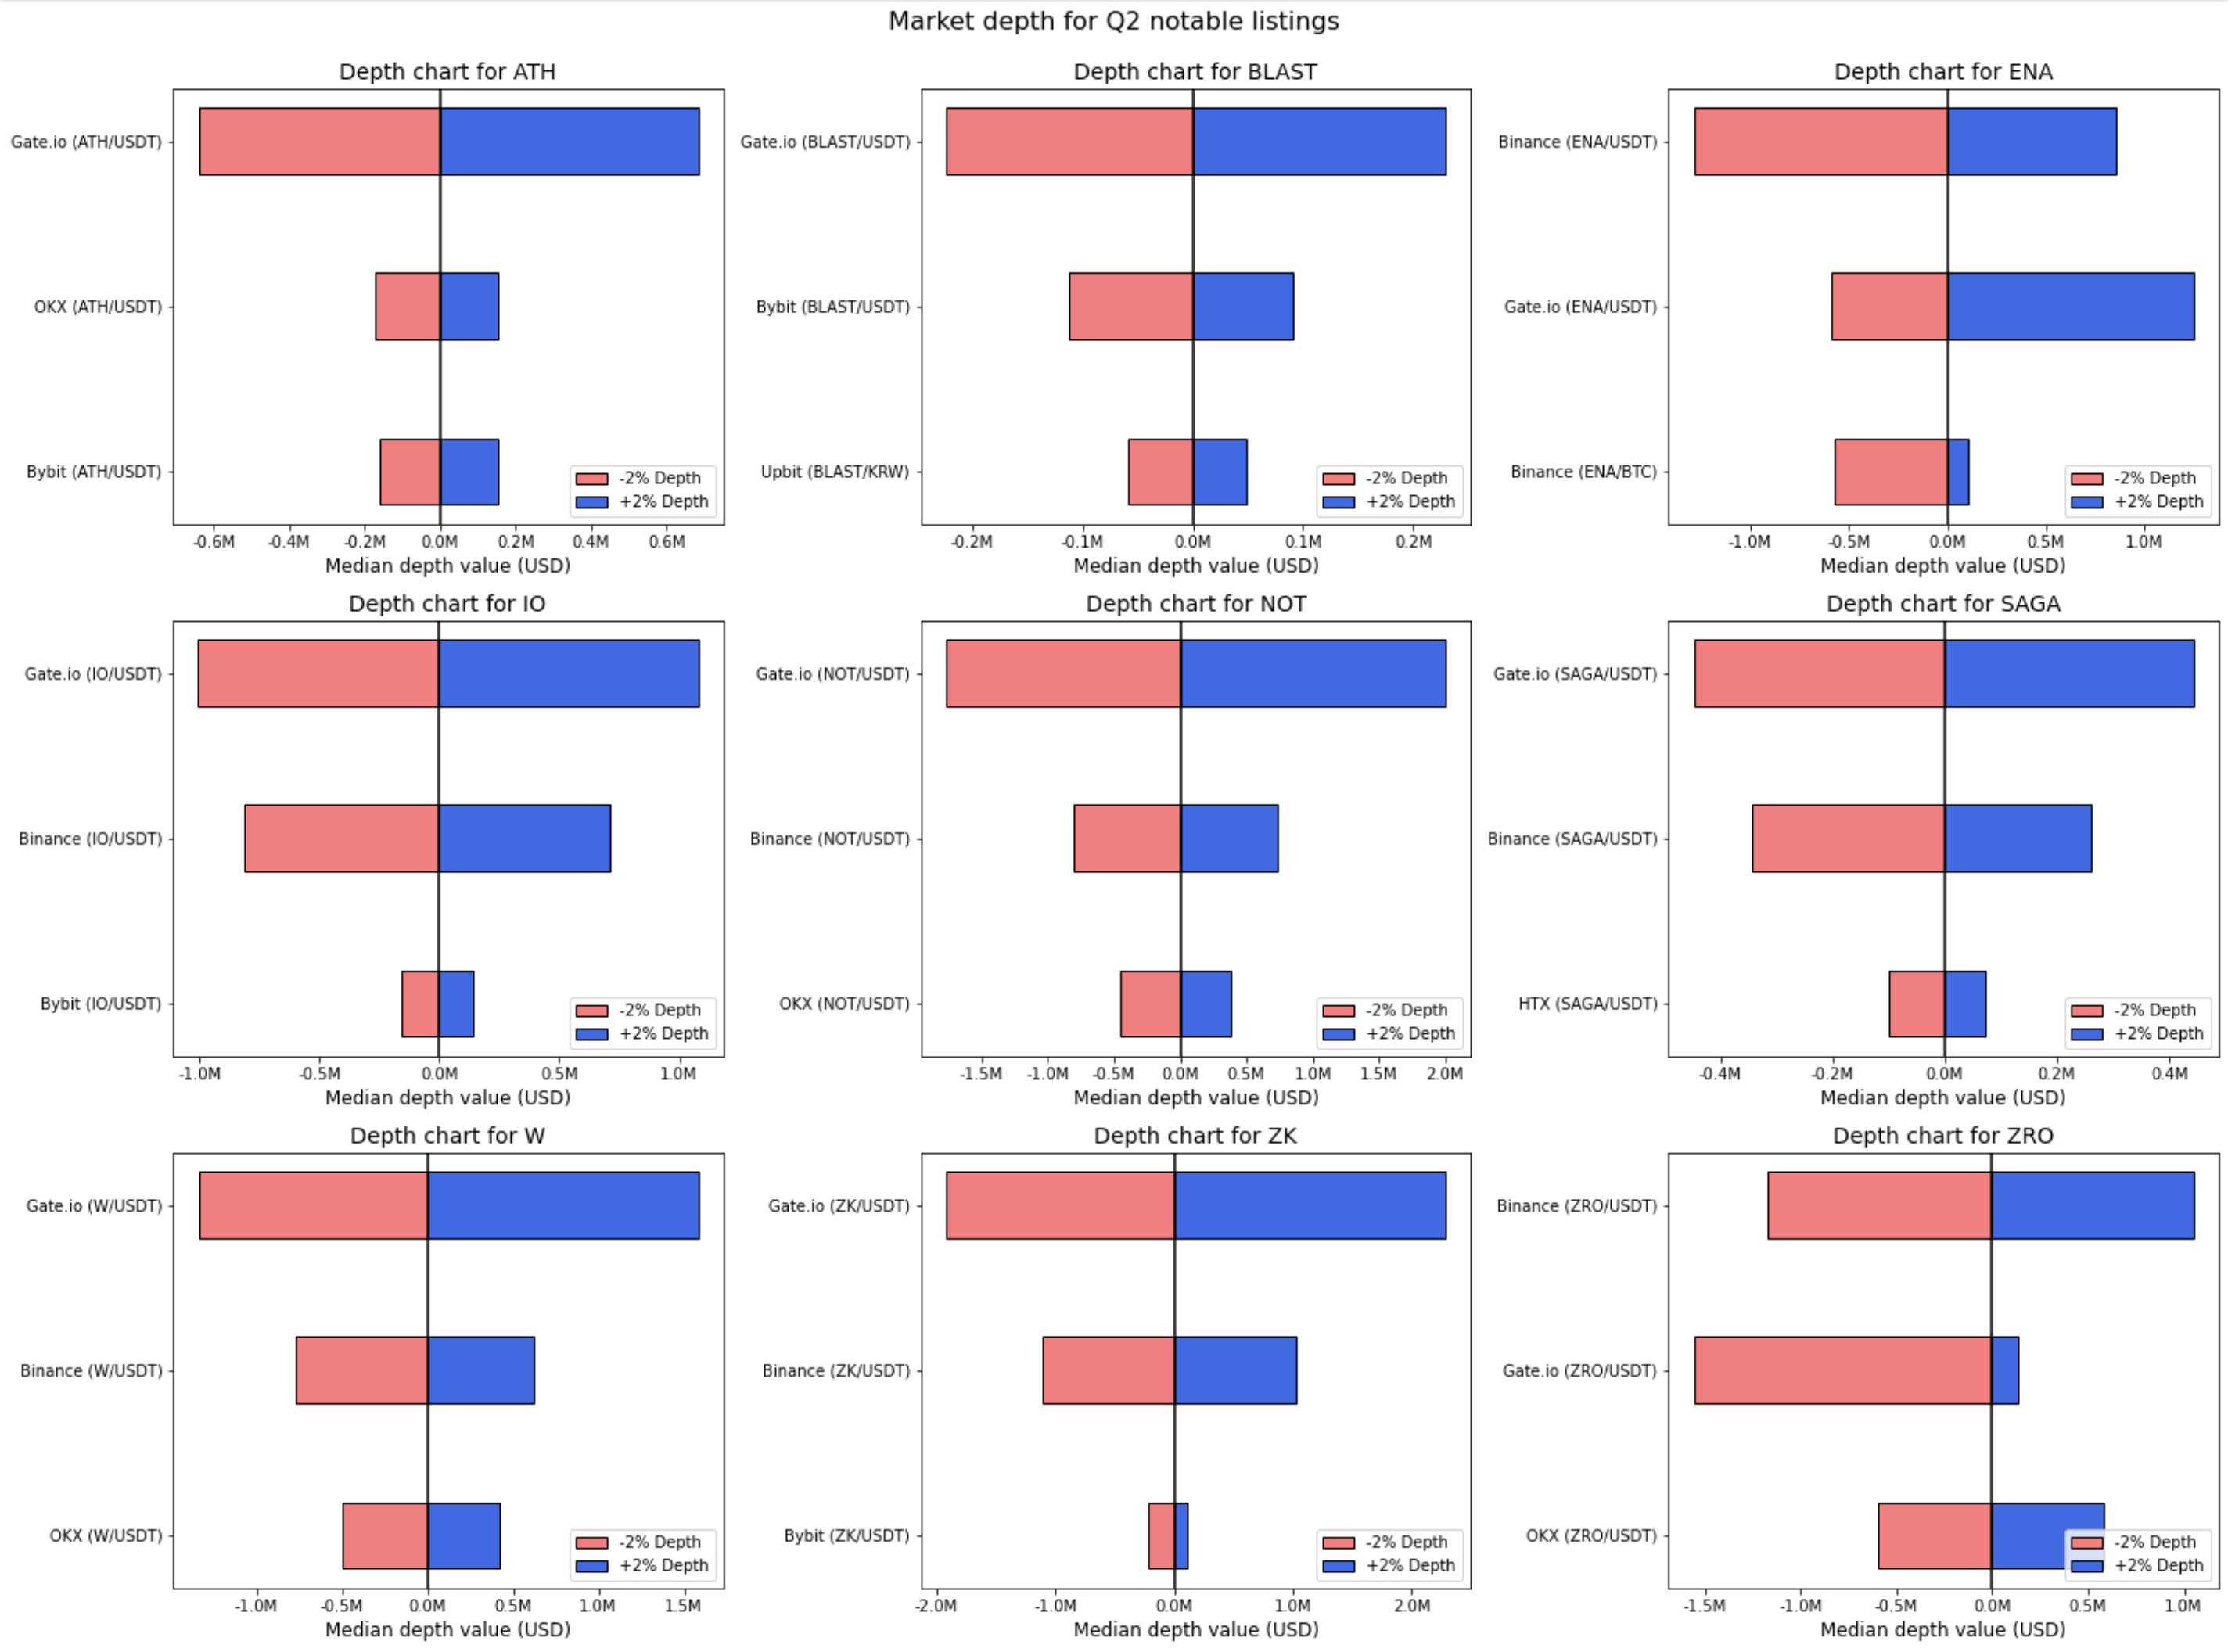
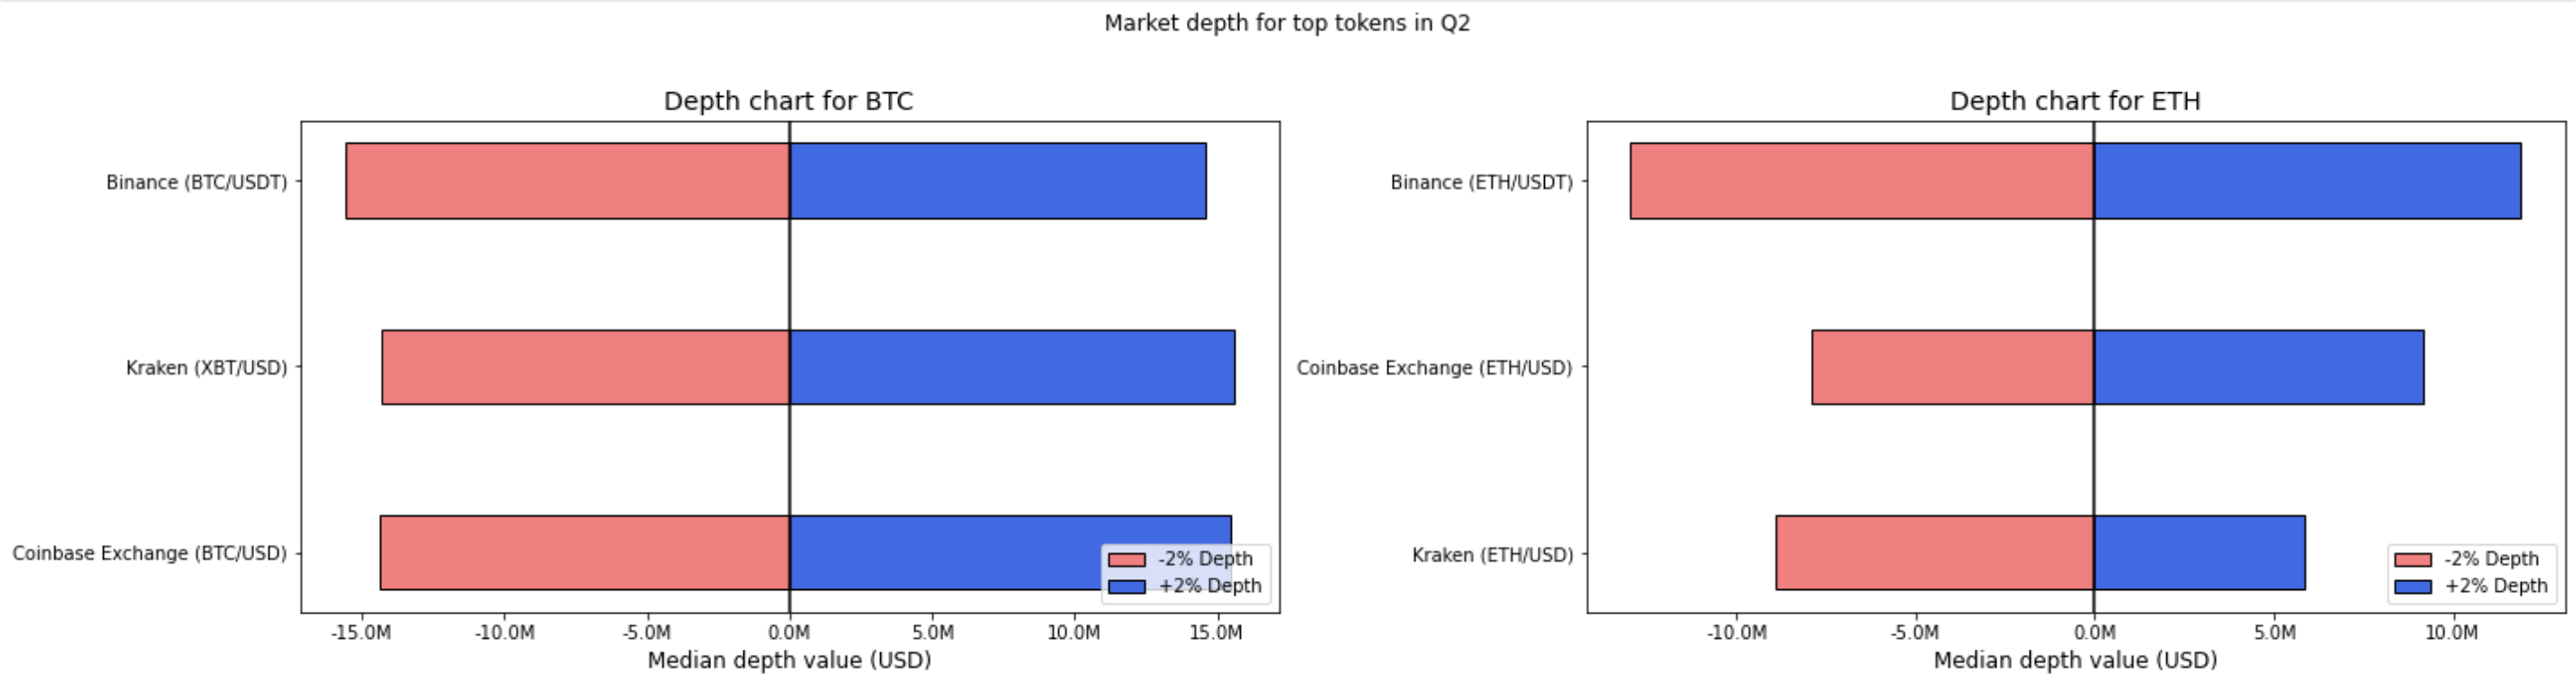
Figure 10: Depth Charts for Q2 Notable Listings in Comparison to BTC and ETH. (Note the different magnitude of x-axis scale.
- Market leader performance is even more apparent here – Gate edging Binance out in a surprising number of notable listings with superior depth has piqued our curiosity.
c. Price Movement
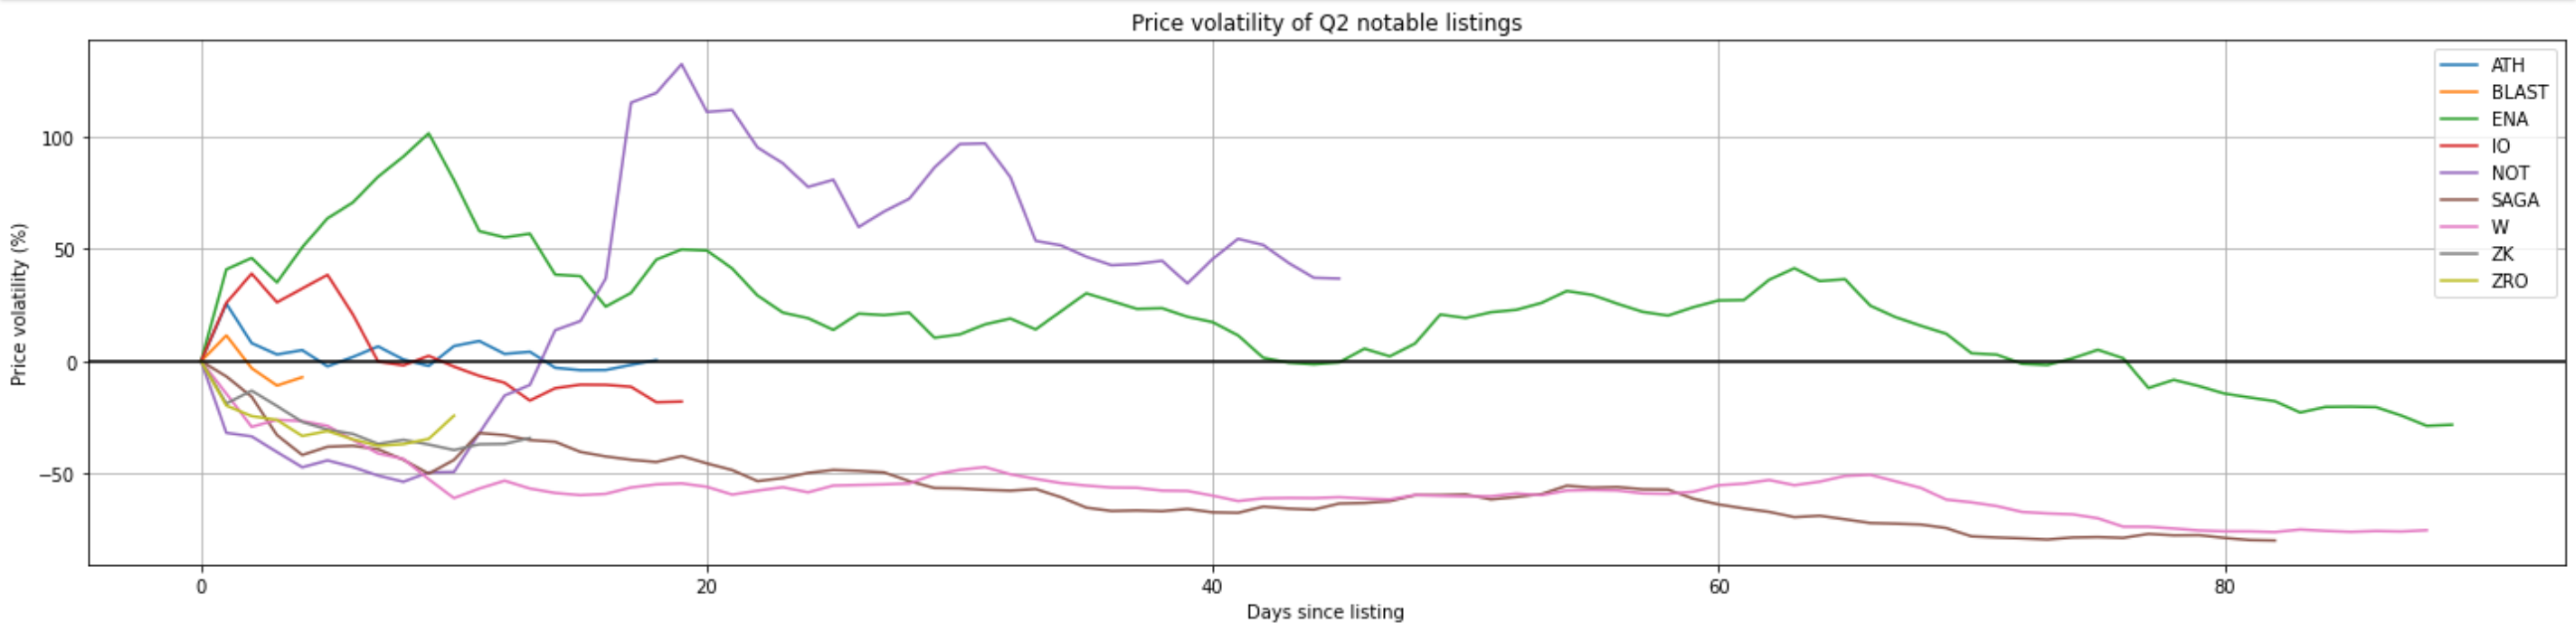
Figure 11: Price volatility of Q2 notable listings
- NOT outperformed despite a significant drawdown from the outset – ENA was strong from the start but gradually lost momentum.
- Other coins mostly performed worse, experiencing price volatility to the downside from the outset.
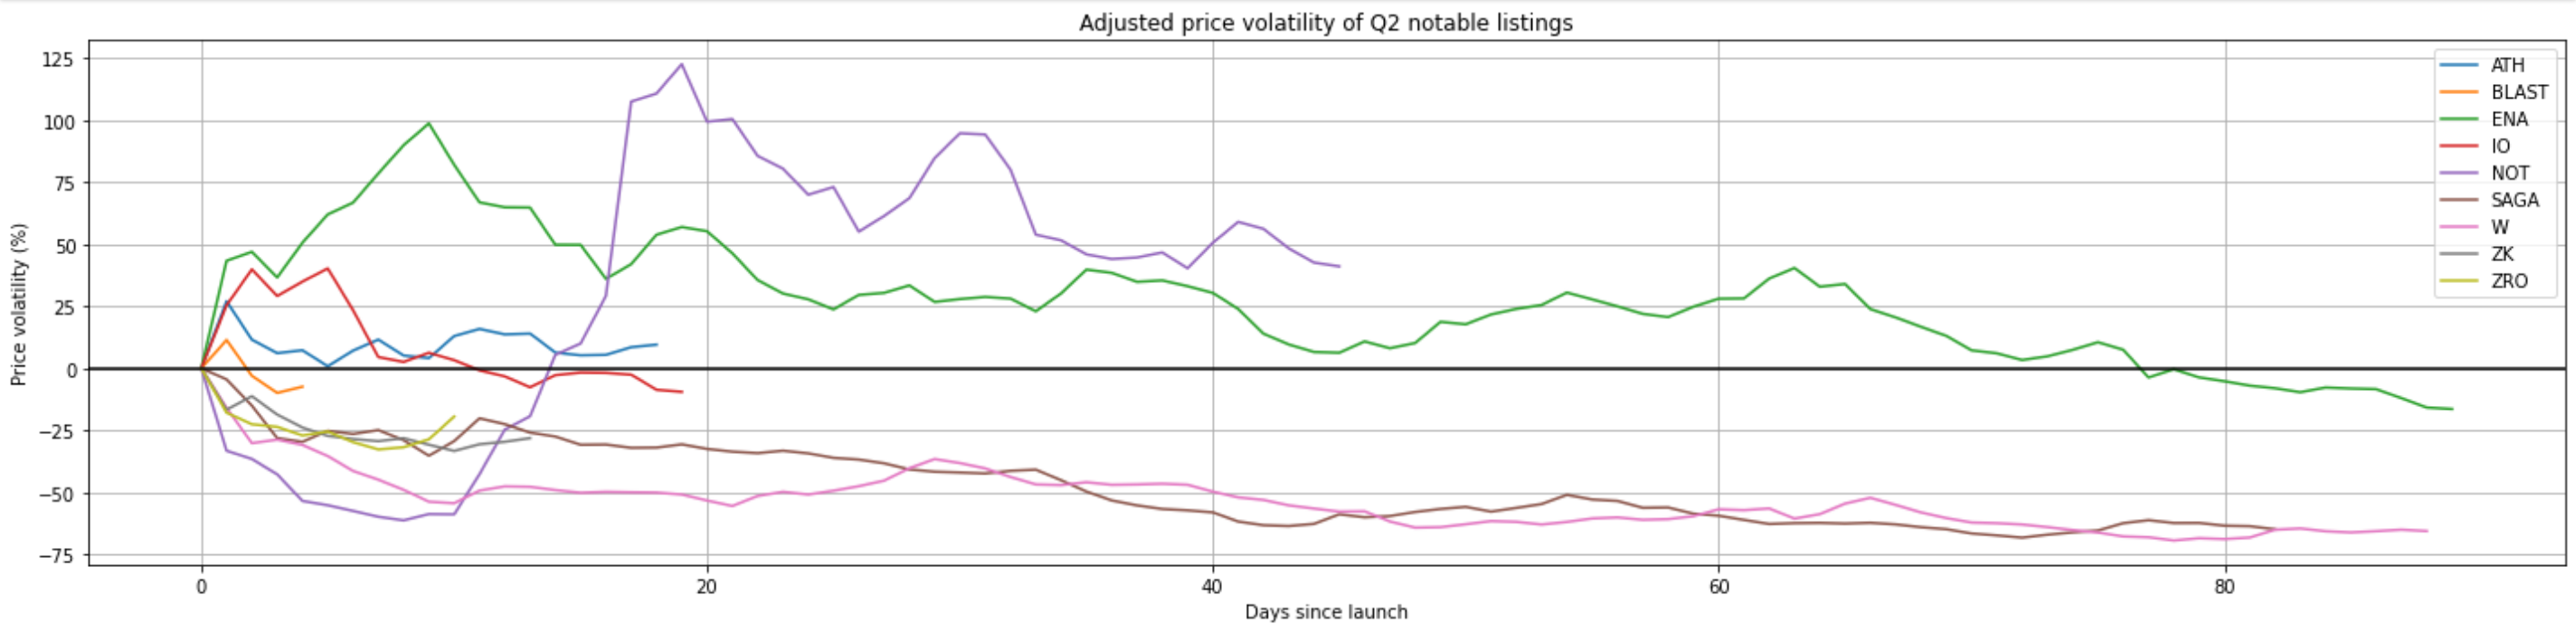
Figure 12: Index-adjusted price volatility of Q2 Notable Listings
- Adjusting for overall crypto market price performance (benchmarked against Coindesk Crypto Index), the general story above remains the same with the same underperformers and overperformers.
- General market weakness resulting in bearish momentum despite strong teams and excellent products from the Notable Listings this quarter.
- Projects should consider strategic planning around their listing date to avoid their token getting caught in bearish market momentum.
Conclusion
Overall, Q2 2024 was a mixed bag for crypto, with some wins with Memecoins and select few projects. With the backlash around VC coins, it is likely that the listing machine will be more wary in the next quarters, and we may see some changes in tokenomics.
As the AI and crypto convergence strengthens, we’re also seeing a gradual increase in both the popularity and number of AI coins being listed on top exchanges. In particular, several upcoming projects are demonstrating promise such as Heurist, Ritual, Masa and Sentient.
Despite these challenges, the market remains resilient — several upcoming catalysts such as the Ethereum ETF approval by summer, warming of political opinion about crypto and the potential election of a crypto-friendly US President such as Trump (or an about-face by incumbent Democrats to curry popularity), among others, could spark a marketwide rebound this quarter and keep the bull market music going.
