Home » Blog » How Developer Activity Affects Prices
How Developer Activity Affects Prices
Data Analysis, Industry Analysis
Stephany Zoo
Developer Relations is a common role at most L1/L2’s, with salaries averaging at $81K, or going up to $200K at top protocols like Monad. In most ecosystems, DevRel is crucial in growing and supporting early developer communities, and covers a lot of responsibility from developing programming resources to doing actual integrations. This is all to emphasize the importance of having vibrant developer communities building on protocols.
In Web2, increased usage of a technology often has direct links to the price to the company’s stock price. Electric Capital’s Developer Report actively tracks monthly activity across main ecosystems. Therefore, we were interested in seeing if increased developer activity made an impact on the price of the token.
Is there a relationship between developer activity and prices / sentiment? (with statistical significance)
Can developer activity be a leading indicator for prices /...
Deeper Insights Ahead
Developer Relations is a common role at most L1/L2’s, with salaries averaging at $81K, or going up to $200K at top protocols like Monad. In most ecosystems, DevRel is crucial in growing and supporting early developer communities, and covers a lot of responsibility from developing programming resources to doing actual integrations. This is all to emphasize the importance of having vibrant developer communities building on protocols.
In Web2, increased usage of a technology often has direct links to the price to the company’s stock price. Electric Capital’s Developer Report actively tracks monthly activity across main ecosystems. Therefore, we were interested in seeing if increased developer activity made an impact on the price of the token.
Is there a relationship between developer activity and prices / sentiment? (with statistical significance)
Can developer activity be a leading indicator for prices / sentiment?
The conventional way most open source projects analyse developer activity is by looking Github commits (eg. Cryptomiso). However, looking solely at Github commits skews the data, so we used Santiment Development Activity scale, including developer activity based on Github events, including
Pushing a commit
Creating an issue and closing an issue
Creating a pull request
Commenting on or following an issue
Starring a repository
Github project management events
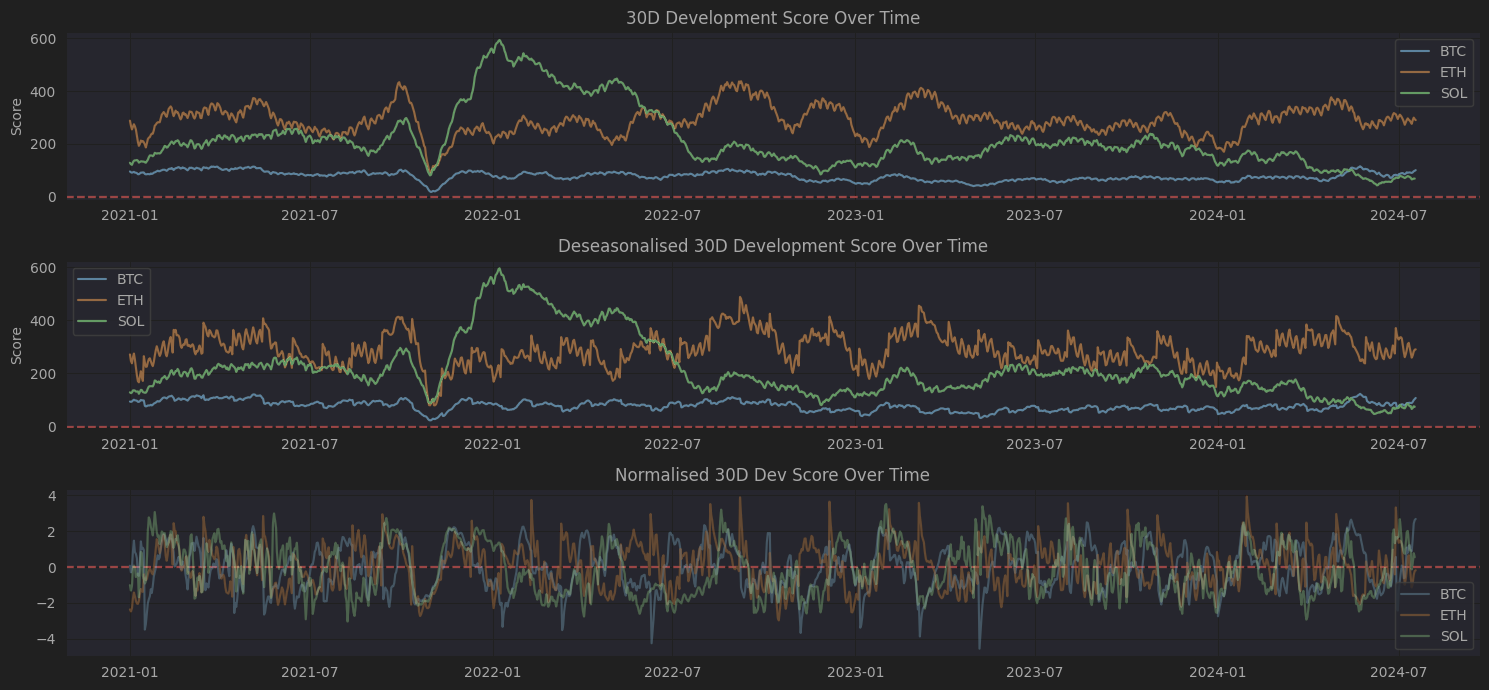
We analysed the 30d developer score across 32 different protocols from varying verticals:
Next, we deseasonalized the 30d developer score and normalized it after. Deseasonalizing the developer score helps us compare the relative levels of activity over time and across different projects. By normalizing, we can see how developer activity deviates from the average, making it easier to identify significant changes or trends.
In the example of BTC, ETH and SOL, there was a dip in developer activity around Oct/Nov 2021 (tip of the bull market). Thereafter, SOL had high developer activity before its continued decline after July 2022 (around when FTX meltdown happened).
Figure 1. Change in Data after Deasonalization and Normalization
Cross Sectional Analysis of Crypto Developer Activity
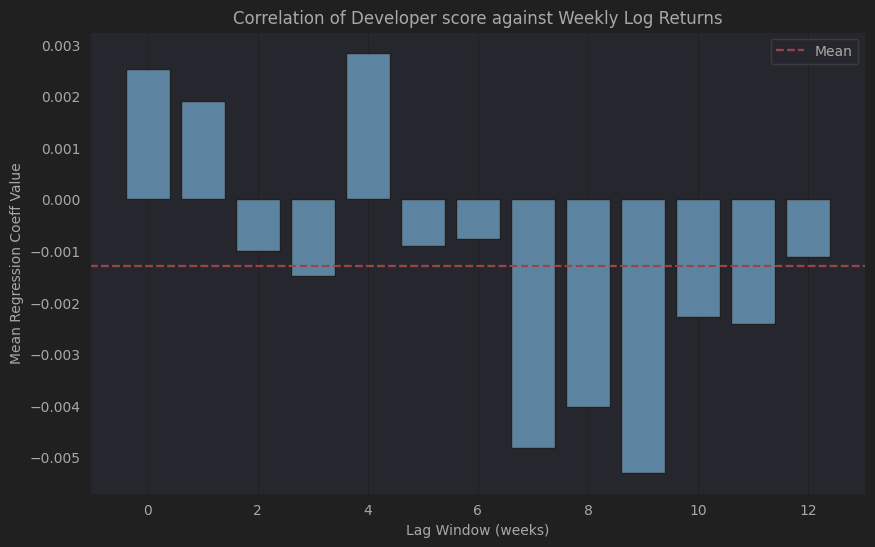
To test if the Santiment score could be used as a leading indicator, we lagged the target value (log returns or sentiment) by a maximum of 12 weeks, which would allow sufficient time for the market to price any development changes to the project.
Mean: -0.00129
Analysing how 30d developer score (normalised) affects weekly log returns of the 32 symbols, we can see that the correlation strength is near 0, which indicates that there is no relationship between Developer Score and Weekly Log Returns.
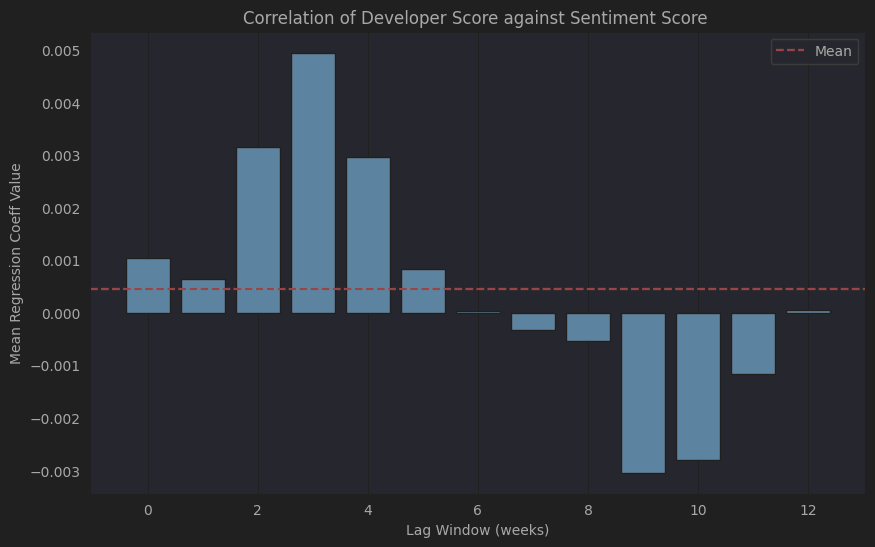
Mean: 0.00044
Even for the cross sectional analysis of running 30d Developer score (normalised) against Kaito’s weekly sentiment score, the correlation strength was near 0, which indicates that there is no relationship between Developer Activity and Sentiment.
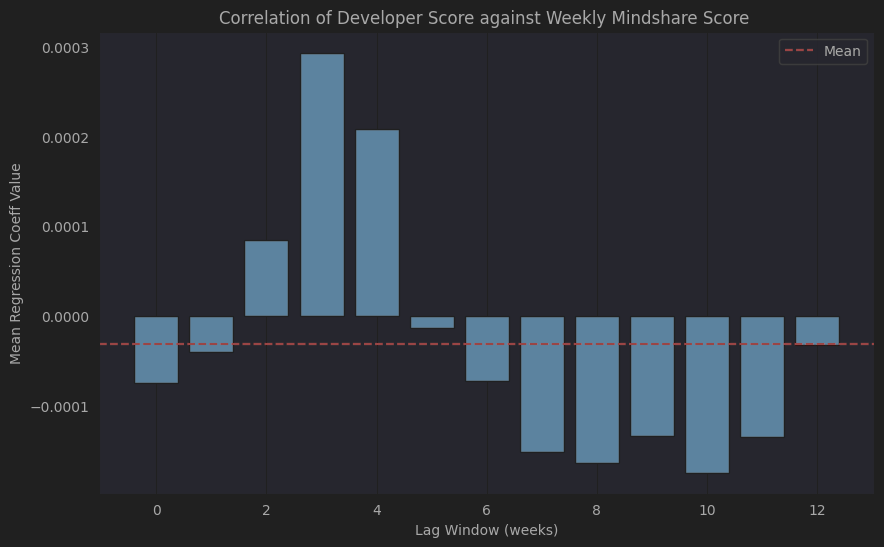
Mean: 0.0000313
The same could be said for the analysis of running 30d Developer activity (normalised) against Kaito’s weekly mindshare score, the correlation strength was near 0, which again indicates no relationship.
While Github events can be proxy for the amount of developer engagement, it does not necessarily reflect the general developer interest or even the quality of developers who are building on a specific protocol. This could be further investigated with the number of actual live projects, or even location of developers.
Developer Activity has No Impact on Crypto Token Price
Even though we found no correlation between the price of the token and developer activity, having an active developer community is still one of the most important aspects of a strong protocol. Having more developers, in the short term will not make your price go up, but having fewer developers will definitely make a long term negative impact on price.
This post is for general information purposes only. It does not constitute investment advice or a recommendation or solicitation to buy or sell any investment and should not be used in the evaluation of the merits of making any investment decision. It should not be relied upon for accounting, legal or tax advice or investment recommendations. This post reflects the current opinions of the authors and is not made on behalf of Caladan Group or its affiliates and does not necessarily reflect the opinions of Caladan Group, its affiliates or individuals associated with Caladan Group. The opinions reflected herein are subject to change without being updated.